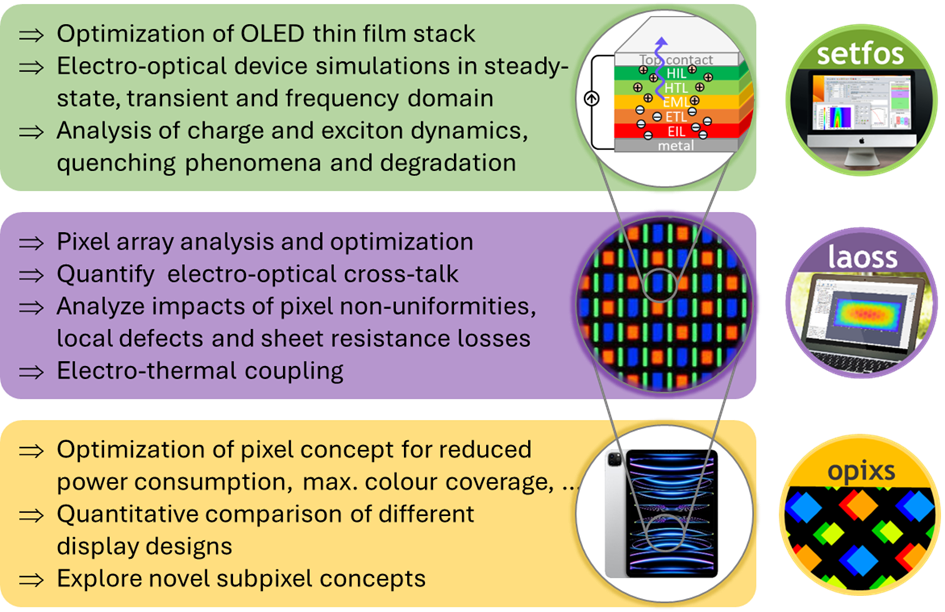
What is Opixs and why do you need it?
Abstract
Opixs is a newly developed simulation tool by Fluxim for optimizing pixel structures in advanced display technologies. It computes power-efficient subpixel combinations, evaluates colour gamut coverage, and analyses spatial subpixel usage for real content. Opixs enables comparative studies of pixel layouts, brightness scaling, and emerging architectures such as tandem and vertically stacked OLEDs. It also quantifies the impact of current efficacy roll-off and driving voltage on power consumption, supporting design decisions that reduce energy use and extend display lifetime before physical prototyping.
Introduction to Different Display Concepts
To visualise multi-coloured content, display devices require at least 3 primary colours. The area these primary colours span on the CIE colour diagram define the colour gamut of a display. In Figure 1 different commercially employed display technologies with their respective advantages and challenges are presented. Most of them use only 3 subpixels with red (R), green (G) and blue (B) primary colours. Only in RGBW displays, typically employed in LG OLED TVs, an additional white OLED subpixel is employed to enhance the brightness. However, also in this case only 3 out of the 4 subpixels are on simultaneously.

Figure 1. Different display technologies used in nowadays commercial devices with respective advantages and challenges.
What is Opixs?
Fluxim has been supporting scientists and engineers working on display technologies along the full value chain with dedicated simulation tools. Setfos for electro-optical device simulations on a microscopic level and Laoss for electro-thermal and optical analysis of pixel arrays. To address the length-scale of the full emissive frontplane, we have developed a new simulation tool “Opixs” within the Innosuisse – Innovate UK project “DISCO”. The name is derived from Optimizing PIXel Structures to indicate the overall purpose of the simulation software. Opixs is used to quantify the power consumption of pixel structure to display specific content, analyse the colour gamut coverage and subpixel usage, as well as to virtually explore novel pixel concepts. In this blog post, we want to demonstrate typical application examples and substantiate the claims mentioned in the illustration below.
Opixs Input, Workflow & Results
To perform a first simulation with Opixs, the user defines input parameters related to the display technology and the content to be displayed (see Figure 2).
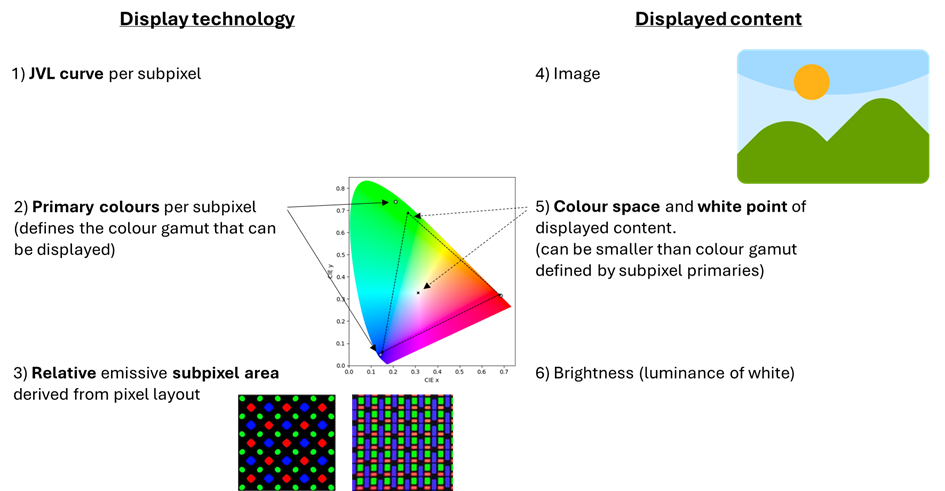
Figure 2. Overview of input parameters necessary for Opixs.
To illustrate the workflow directly with a realistic example, we are going to model a RGBW display. Nam Sung Cho and co-workers at ETRI in Korea performed a thorough study demonstrating two white OLEDs and combined them with two sets of colour filters.[1] We employ their YGB WOLED data combined with the reported CF-K colour filter set.
In particular, the input comprises the following:
The JVL curves of all subpixels.
Note that the luminance values should already include all additional optical elements that may be considered (e.g. circular polarizers, optics for outcoupling enhancements).
Note also that one could also assess a viewing angle for the display aside from 0°. In such a case, one would also need to modify the luminance scaling.
For our example, we use the JVL curve from the publication directly for the W subpixel. The JV curve is also the same for the 3 other subpixels but the luminance had to be adjusted for R, G, and B subpixel using the luminance reduction listed in the publication (see Figure 3).[1]

Figure 3. Luminance-voltage curve used for the RGBW display example. Original data published in [1]
2. The primary colours for the different subpixels.
Same as for the luminance values, optical elements or different viewing angles should be considered if appropriate.
Here we can again readily employ the CIE xy colour coordinate data provided in the publication.
3. The relative subpixel area corresponds to the emissive part of one repeating unit. If there is non-emissive area (black matrix), the sum of all relative areas can be below 1.
Analysing our LG OLED TV revealed that the emissive area of all subpixels is similar. For simplicity, we neglected any dark area and assumed a relative subpixel area of 0.25 for all 4 colours.
4. The image to be displayed. These test images can be be chosen to reflect the application specific content to be displayed. This could be photographs (for cameras, smartphones, TVs) but also gaming scenes, documents or websites (for laptops, tablets).
For our studies below, different photographs taken in Switzerland were considered.
5. The colour space and the white point of the display. Typical colour gamut standards for displays are sRGB, DCI-P3, and Rec.2020.
Note that content that cannot be displayed using the primaries defined in 2) will be treated separately but these pixels do not count towards the total power consumption.
We set the colour gamut in our simulation equal to the gamut spanned by the RGB primaries. As a white reference we use D65.

Figure 4. Colour diagram indicating the chosen primaries for RGBW from the publication, DCI-P3 and D65 standards.
6. The brightness of the display determines the target luminance for pure white.
If not specified differently, we use 1000 cd m-2.
With the above defined content, Opixs will calculate the most efficient combination (lowest power consumption) of the 4 subpixels for each pixel of the loaded image to be displayed. The main result of Opixs is the power density (per subpixel) required to display a certain content. Beyond scalar key figures, also power density maps as shown in Figure 5 (b and d) are presented which allows one to analyse the spatial distribution of power density and compare it with the content to be displayed (a). In Figure 5c one can also inspect whether a specific (here blue) subpixel is turned on or off. In the example here, we see that the blue subpixel is not emissive in regions of grass and trees (green). This is because in these regions, the triangle spanned by RGW is more efficient (see also Figure 6, top right). The power density map for the blue subpixel (Figure 5d) further reveals that the power for the blue is highest for the blue flowers as their colour is close to the edge of the colour gamut.
Figure 5. a) Input image to be analysed and b) total power required for this image using the RGBW display technology described above. c) Spatial analysis of blue subpixel usage and d) power required of the blue subpixels.
As mentioned earlier, only 3 out of 4 subpixels are turned on locally. Figure 6 shows the usage of the 4 available combinations of 3 different subpixels for this RGBW example. Clearly, the RGB combination is the most inefficient combination due to the use of colour filters. Opixs confirms the expected: this RGB subpixel combination is not in use anywhere.
Figure 6. Spatial usage of the 4 colour triangles spanned by 3 subpixels.
Application Examples
In this section, we will introduce several case studies which can be performed with Opixs. The basic display technology that we will use is a RGB side-by-side pixel structure. As JVL and colour coordinates for the subpixels (input 1 and 2 above), we again use data from literature which report both high efficiency and CIE colour coordinates that match or exceed the DCI-P3 gamut. Figure 7 shows the JVL and current efficacy curves of the RGB subpixels, while Table 1 shows peak efficacy and the colour coordinates.
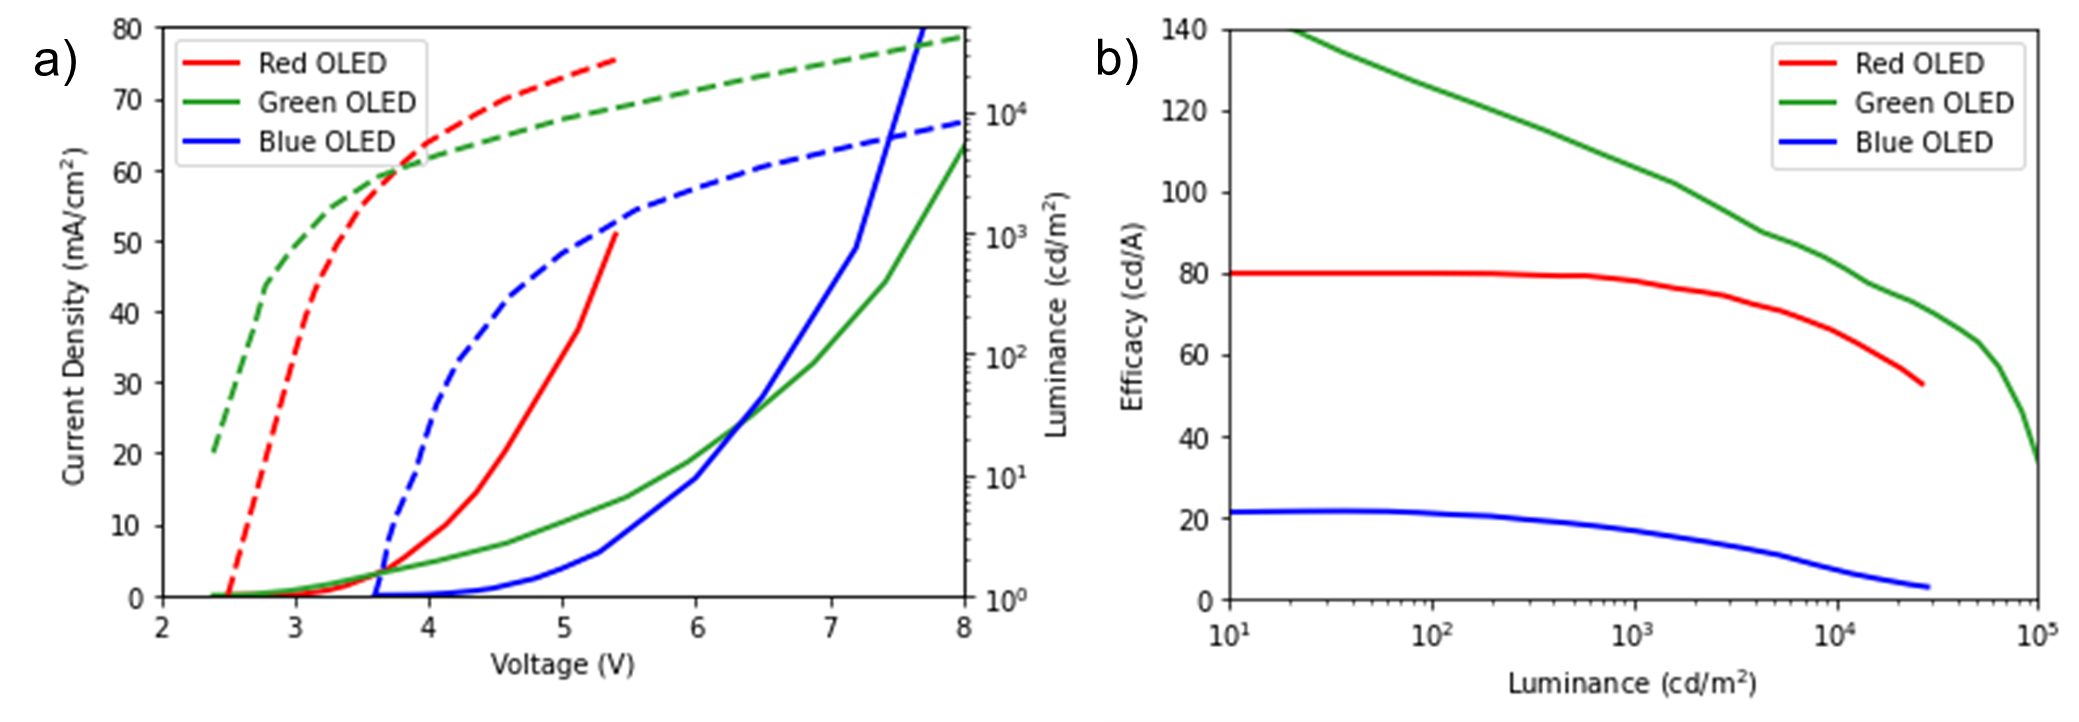
Figure 7. a) JVL curves from literature used for red [2], green [3] and blue [4] subpixels. b) current efficacy roll-off of the respective OLEDs.
Table 1. CIE colour coordinates and peak efficacy of the RGB subpixels of the pixels shown in Figure 7.
| CIE (x, y) | Peak efficacy [cd/A] |
|
|---|---|---|
| Red | (0.685, 0.315) | 79.9 |
| Green | (0.21, 0.74) | 142.8 |
| Blue | (0.141, 0.05) | 21.9 |
Before demonstrating different application examples with Opixs, we show the simulated power maps of 7 different photographs in Figure 8. The averaged total power in the bar plot indicates the large variance of a factor > 2 in required power for different images. This demonstrates that a set of application specific test images should be chosen to perform quantitative and comparative studies with Opixs.

Figure 8. Photographs ("displayed content") and corresponding calculated power density maps with Opixs. The bar plot shows the large variation in total power required to display different content.
Layout Comparison
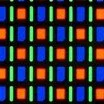
The pixel layout used in commercial displays varies largely depending on manufacturer, display generation and application. An overview of display pixel layouts is for example available here. For the comparison here, we selected four different pixel layouts and determined the emissive area per subpixel from photographs, as this information is usually not provided by display manufacturers (see Table 2).
Table 2. Different pixel layouts, absolute and relative subpixel emissive area.
Images and if available pixel area taken from the following references: https://www.oled-info.com/nouvoyance-explains-why-pentile-oleds-last-longer; https://www.oled-info.com/gs5-diamond-pixel-architecture-not-same-gs4; https://www.oled-info.com/galaxy-note-2-uses-non-pentile-oled-display-267-ppi; https://www.oled-info.com/macro-photo-nintendo-switch-oled-shows-it-not-pentile-display
| Name | R : G : B (emissive area w.r.t. total pixel area) | R : G : B ratio (normalized to total pixel area) | |
|---|---|---|---|
|
RDBG PenTile |
0.11 : 0.13 : 0.13 (37%) | 0.32 : 0.31 : 0.37 |

|
RDBG Diamond |
0.052 : 0.052 : 0.052 (16%) | 0.33 : 0.33 : 0.33 |

|
RGB S-Stripe |
0.064 : 0.074 : 0.19 (33%) | 0.27 : 0.27 : 0.46 |
|
RGB Shift S-Stripe |
0.074 : 0.16 : 0.24 (48%) | 0.18 : 0.37 : 0.45 |
In Figure 9 the total as well as the subpixel power consumption to display the image from Figure 5a is shown. If the non-emissive (black) area is considered, the different pixel layouts result in significantly different power consumption (Figure 9a) with the RGBG Diamond layout being the most inefficient. The latter is attributed to the fact that only 16% of the pixel area is emissive which is half or even less compared to the second lowest value (RGB S-Stripe). When normalizing the total subpixel area to the pixel area (sum of RGB equal to 1), the difference in power consumption is negligibly small for the different pixel layouts (Figure 9b).
It's also interesting to analyse the red, green and blue subpixel power consumption for different pixel layouts. Often, the blue subpixel’s relative area is larger than green or red due to the typically lower efficiency. For the example here, we can see that this approach indeed results in a somewhat smaller power for blue in the RGB (Shift) S-Stripe layouts compared to the layouts with smaller relative blue area (RGBG PenTile and Diamond). Due to the analysed content here (Figure 5a), the green subpixel always requires the highest power, emphasising the importance to use application-specific content for an in-depth (pixel layout) comparison.
Figure 9. Simulated total and subpixel power for different pixel layouts per display (a) and emissive area (b) for the image in Figure 5a.
This example demonstrates that Opixs can be used to optimize the subpixel area ratios and thereby give indications for the pixel layout with the lowest power consumption. It should be emphasized again that such an optimization should consider the application specific content to be displayed.
Brightness Scaling
The automatic adjustment of display brightness in smartphones to match the surrounding lighting conditions is a common feature. While general light conditions require display luminance in the range of 100 – 500 cd m-2, displays operated under outdoor lighting conditions need to be above 1000 cd m-2.[5] Thus, it is important to understand how the display power consumption changes when the brightness is modified.
Figure 10 illustrates the dual effect on the power when increasing the luminance of an OLED device. To increase the luminance by a factor of 10 (black arrow) at least 10x higher current is needed and thus a higher driving voltage (Figure 9a, effect 1), which leads to a super linear power increase (P = V*I). Additionally, due to the typically observed current efficacy roll-off, the required current increase to achieve a 10 times higher luminance (Figure 9b, effect 2) can be significantly larger than a factor of 10, depending on the roll-off. Both effects are illustrated for the blue OLED shown above.
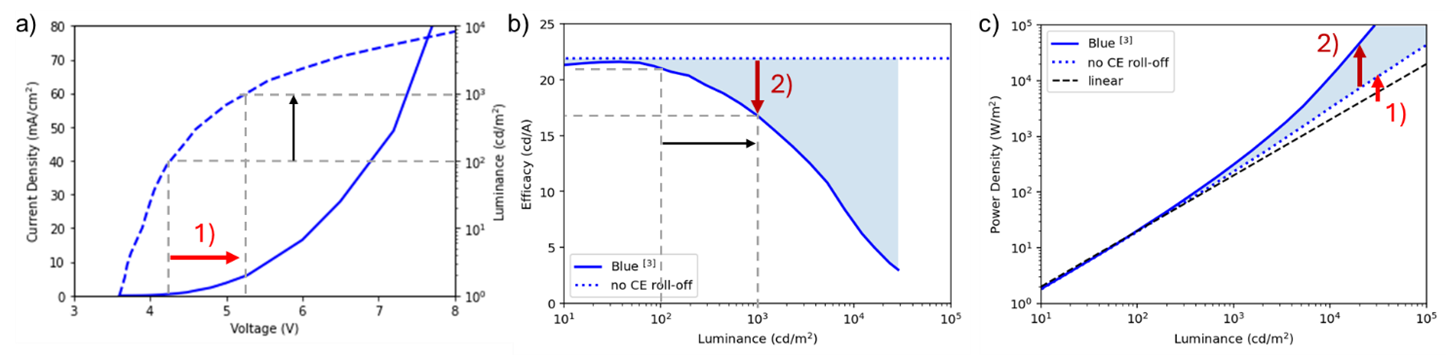
Figure 10. Effect of increasing the brightness. a) increase the luminance of the subpixel by a factor of 10 changes the JV working point of the OLED. b) Due to the CE roll-off, a factor of 10 increase in luminance requires more than a factor of 10 higher current to drive the OLED. c) power-luminance relation of a subpixel illustrating the effect of roll-off (2) and increased power (1).
The impact of display brightness on power consumption illustrated above has two implications for the optimization of subpixel device properties.
1) Decreasing the turn-on voltage of a device directly results in a power reduction at constant current ().
Ultralow turn-on voltage of OLEDs have been demonstrated in literature.[6,7]
2) Reducing efficacy roll-off by mitigating non-radiative polaron and exciton quenching processes.
Engineering emitter, emission layer and/or stack design has been proven to reduce CE roll-off.[8–10]
Both aspects can be addressed by careful assessment and stack design using electro-optical device simulations in Setfos.
Quantifying the impact of the roll-off on the display power consumption is straightforward to simulate in Opixs. We therefore modified the luminance-voltage behaviour of all 3 subpixels in Figure 7 to exhibit a constant CE value. Figure 11 shows the total and subpixel power consumption for the RGB display at 1000 cd m-2. The total power consumption could be reduced by 16% if all the subpixels would not exhibit a CE roll-off. The green subpixel, showing the strongest loss compared to the peak efficacy (see Figure 7 and Table 1), would benefit the most.
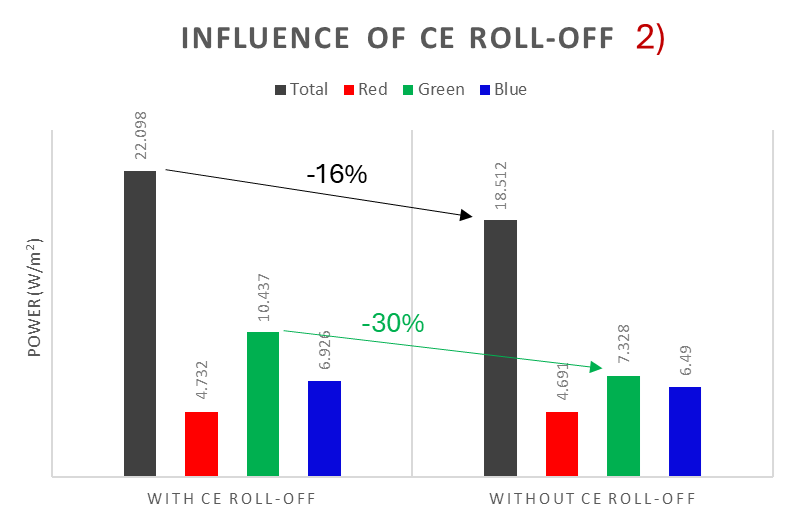
Figure 11. Power consumption of RGB display with (left) or without (right) roll-off to display content at 1000 cd m-2 highlighting effect 2) indicated in Figure 10 and described in the text.
Technology Comparison
Another approach to increase the brightness of a device at a fixed current density is the use of monolithically stacked multi-junction devices. Stacking two units on top of each other results in a tandem OLED device. This technology has been adopted in newer generations of Apple’s iPad Pro, for which LGD provided most of the displays. Recent reports announced that LGD starts to produce tandem OLED laptop panels which require up to 40% lower power – a perfect use case for Opixs.
In this section we compare 4 display concepts based on only 3 primary colours (see Figure 12). While single junction and tandem RGB side-by-side technology exists commercially (see Figure 1), vertically stacked, individually addressable RGB devices exist only as demonstrators[11] and are part of ongoing development.

Figure 12. Sketches of display technologies to be compared in terms of power consumption using Opixs.
To generate the input data for the tandem sub-pixels, we assumed a lossless single-junction to tandem conversion and did not consider any modified optical effects due to the new OLED stack structure. In future studies, electrical and optical losses could be considered by modelling the devices with Setfos. Also, for the vertical stacking with respect to the side-by-side arrangement, we did only change the relative emission area in Opixs from 0.33 to 1, effectively neglecting any optical modification due to the stacking.
The resulting power consumption for the different display technologies is presented in Figure 13 and Figure 14 without and with current efficacy roll-off, respectively. The power savings with respect to the RGB side-by-side layout increase with increasing device complexity. In particular they amount to 5% (without roll-off to 9%) for the side-by-side tandem, which is somewhat lower than the claims by LG displays. The power savings for vertically stacked RGB concepts amount to 7-18%. These power savings are interesting for a commercial application but probably not a good enough reason considering the strongly increased manufacturing complexity. There is however another good reason for stacking pixels either in tandems or RGB vertically on top of each other which is the lower current density required to obtain the same far-field brightness of the display. This by at least a factor of 2 reduced current density in the subpixels results directly in a display lifetime extension of a factor of 2 or more.
Figure 13. Power consumption of different pixel concepts, sketched in Figure 11, assuming no current efficacy roll-off.
Figure 14. Power consumption of different pixel concepts, sketched in Figure 11, at a luminance of 1000 cd m-2 with current efficacy roll-off.
Assessing Novel Pixel Designs (TurboLED®)
An important motivation for the DISCO project, within which Opixs was developed, was the demonstration of novel pixel concept technologies. In particular, the company Excyton based in the UK, recently patented a display concept called TurboLED®. In addition to 3 deep RGB pixels it employs 3 additional light pixels for each colour. The peak wavelengths of these light pixels have a greater overlap with the human eye’s sensitivity function and therefore exhibit higher current efficacy. Additionally, the use of commercially available, sky blue, phosphorescent blue emitters compared to deep blue, fluorescent emitters further enhances the efficiency. If you want to learn more about the TurboLED® concept, check our webinar with Peter Levermore, the founder of Excyton.
We here employ Opixs to evaluate the TurboLED® concept and quantify the power savings. The JVL curves for the deep subpixels are those from the previous examples without a CE roll-off. 3 light pixel JVL curves were synthetically generated by using the same JV curve as for the corresponding deep pixel and multiplying the luminance by a factor of 1.8, 1.2 and 4.2 for red, green and blue, respectively.
Figure 15 shows exemplary results obtained with Opixs. While the deep red pixel has to be used everywhere for the RGB case, this subpixel is only used where strictly necessary to achieve the desired colour in the TurboLED® design, for example for the Swiss flag. The power density maps demonstrate the reduced power using the novel concept to display the particular image.
Figure 15. Top: analysis of red subpixel usage in established RGB and novel (TurboLED®) display concepts using the simulation tool Opixs. Bottom: power density maps for the two display concepts.
A quantitative comparison of the TurboLED® concept with previously analysed technologies is presented in Figure 16. Even without roll-off, the power savings with respect to RGB side-by-side amount to 40%. This would directly translate to a longer battery life which is essential for portable devices. Analysing the subpixel power reveals that the savings are due to the usage of the light R’G’B’ pixels which have a better current efficacy.
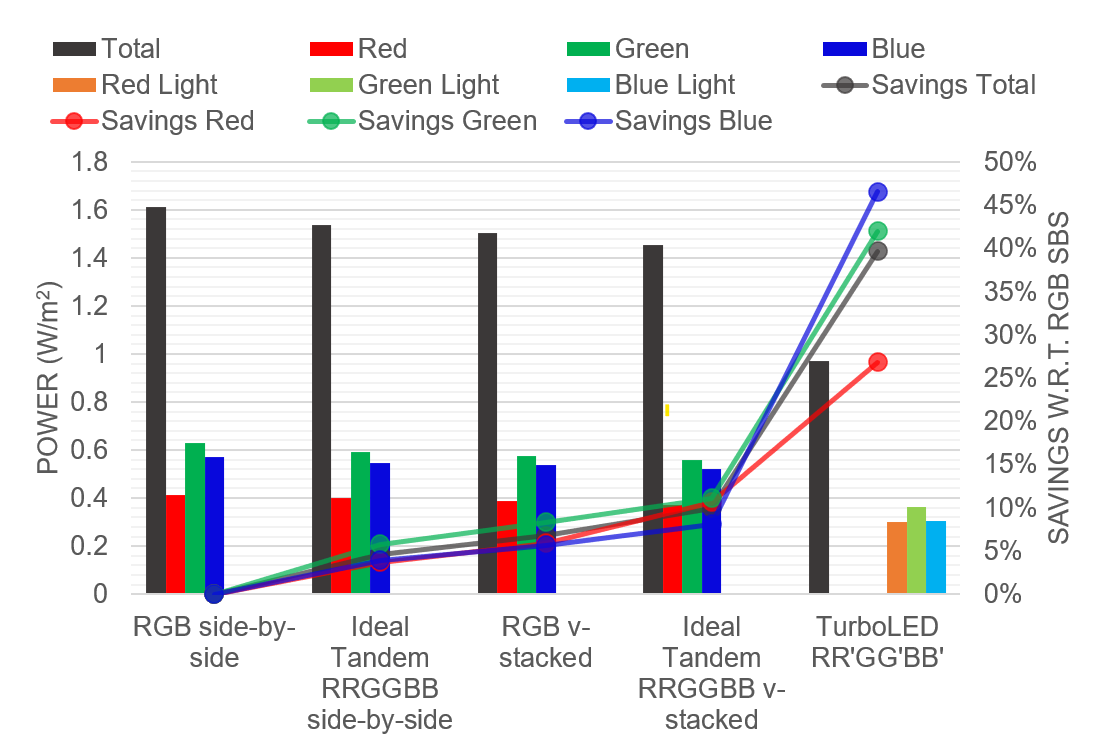
Power consumption for several display concepts without CE roll-off and the corresponding power savings relative to RGB side-by-side technology.
Summary
In this blog post, we introduced the new simulation tool Opixs and demonstrated its functionalities with various application examples. With Opixs one can:
Calculate the most power-efficient subpixel combination
Analyse which and where different subpixels are used to display certain content
Quantify the power consumption of different display technologies and explore novel display concepts
Estimate display lifetime extension
In particular, we used Opixs to analyse the impact of (1) pixel layouts, (2) understand the importance of reducing both the roll-off as well as the driving voltage of OLED pixels and (3) quantitatively compare power consumption of different technologies including tandem structures, vertically stacked and novel pixel designs.
In future work, Opixs may be combined with device simulation performed with Setfos to refine the studies about vertically stacked architectures, as modified optical cavities and reabsorption losses could be taken into account to further optimize the subpixel stacks.
Acknowledgements
Funding from the bilateral Innosuisse – Innovate UK project “DISCO” (109.051 INT-ENG) is greatly acknowledged. We also thank Peter Levermore from Excyton for fruitful discussion and insight into commercial challenges.

References
[1] H. Cho, C.W. Joo, S. Choi, C. Kang, G.H. Kim, J. Shin, B. Kwon, H. Lee, C. Byun, N.S. Cho, Design of white tandem organic light‐emitting diodes for full‐color microdisplay with high current efficiency and high color gamut, ETRI J. (2021) 1–10. https://doi.org/10.4218/etrij.2020-0321.
[2] Q. Xu, J. Wu, Z. Li, Z. Yin, J. Li, X. Li, K. Ueno, A new host material achieving above 75 cd A −1 current efficiency with top-emitting deep-red phosphorescent organic light-emitting diodes, J. Mater. Chem. C. 9 (2021) 13247–13254. https://doi.org/10.1039/D1TC02614C.
[3] J. Liu, X. Yin, M. Huang, J. Miao, N. Li, Z. Huang, C. Yang, High‐Performance Narrowband Pure‐Green OLEDs with Gamut Approaching BT.2020 Standard: Deuteration Promotes Device Efficiency and Lifetime Simultaneously, Adv. Mater. 37 (2025) 1–9. https://doi.org/10.1002/adma.202411610.
[4] T. Hua, X. Cao, J. Miao, X. Yin, Z. Chen, Z. Huang, C. Yang, Deep-blue organic light-emitting diodes for ultrahigh-definition displays, Nat. Photonics. 18 (2024) 1161–1170. https://doi.org/10.1038/s41566-024-01508-w.
[5] S. Scholz, D. Kondakov, B. Lüssem, K. Leo, Degradation Mechanisms and Reactions in Organic Light-Emitting Devices, Chem. Rev. 115 (2015) 8449–8503. https://doi.org/10.1021/cr400704v.
[6] Y. Lian, D. Lan, S. Xing, B. Guo, Z. Ren, R. Lai, C. Zou, B. Zhao, R.H. Friend, D. Di, Ultralow-voltage operation of light-emitting diodes, Nat. Commun. 13 (2022) 3845. https://doi.org/10.1038/s41467-022-31478-y.
[7] S. Engmann, A.J. Barito, E.G. Bittle, N.C. Giebink, L.J. Richter, D.J. Gundlach, Higher order effects in organic LEDs with sub-bandgap turn-on, Nat. Commun. 10 (2019). https://doi.org/10.1038/s41467-018-08075-z.
[8] H. Noda, H. Nakanotani, C. Adachi, Excited state engineering for efficient reverse intersystem crossing, Sci. Adv. 4 (2018). https://doi.org/10.1126/sciadv.aao6910.
[9] T. Zhang, D.-K. Wang, N. Jiang, Z.-H. Lu, Stacking multiple connecting functional materials in tandem organic light-emitting diodes, Sci. Rep. 7 (2017) 43130. https://doi.org/10.1038/srep43130.
[10] Y.X. Hu, J. Miao, T. Hua, Z. Huang, Y. Qi, Y. Zou, Y. Qiu, H. Xia, H. Liu, X. Cao, C. Yang, Efficient selenium-integrated TADF OLEDs with reduced roll-off, Nat. Photonics. 16 (2022) 803–810. https://doi.org/10.1038/s41566-022-01083-y.
[11] M. Fröbel, F. Fries, T. Schwab, S. Lenk, K. Leo, M.C. Gather, S. Reineke, Three-terminal RGB full-color OLED pixels for ultrahigh density displays, Sci. Rep. 8 (2018) 9684. https://doi.org/10.1038/s41598-018-27976-z.