
Five Perovskite Questions Setfos Can Answer From Your Own Measurements
Setfos is a physics-based simulation software from Fluxim AG for thin-film optoelectronic devices, including perovskite solar cells. It couples optical modelling with a drift-diffusion solver and supports mobile ions, multiple trap distributions, and degradation over time. Researchers fit Setfos to measured JV, EQE, luminescence, transient, and impedance data to identify which physical mechanism causes an observed result.
Perovskite device papers are full of phrases that describe a result without explaining it. 'Non-radiative recombination.' 'Hysteresis artifact.' 'Retained 90% of initial PCE.' Each one stands in for a physical mechanism that was never identified.
Below are five questions where a fitted physical model gives an answer that a measurement alone cannot.
What is really limiting the open-circuit voltage of a perovskite solar cell
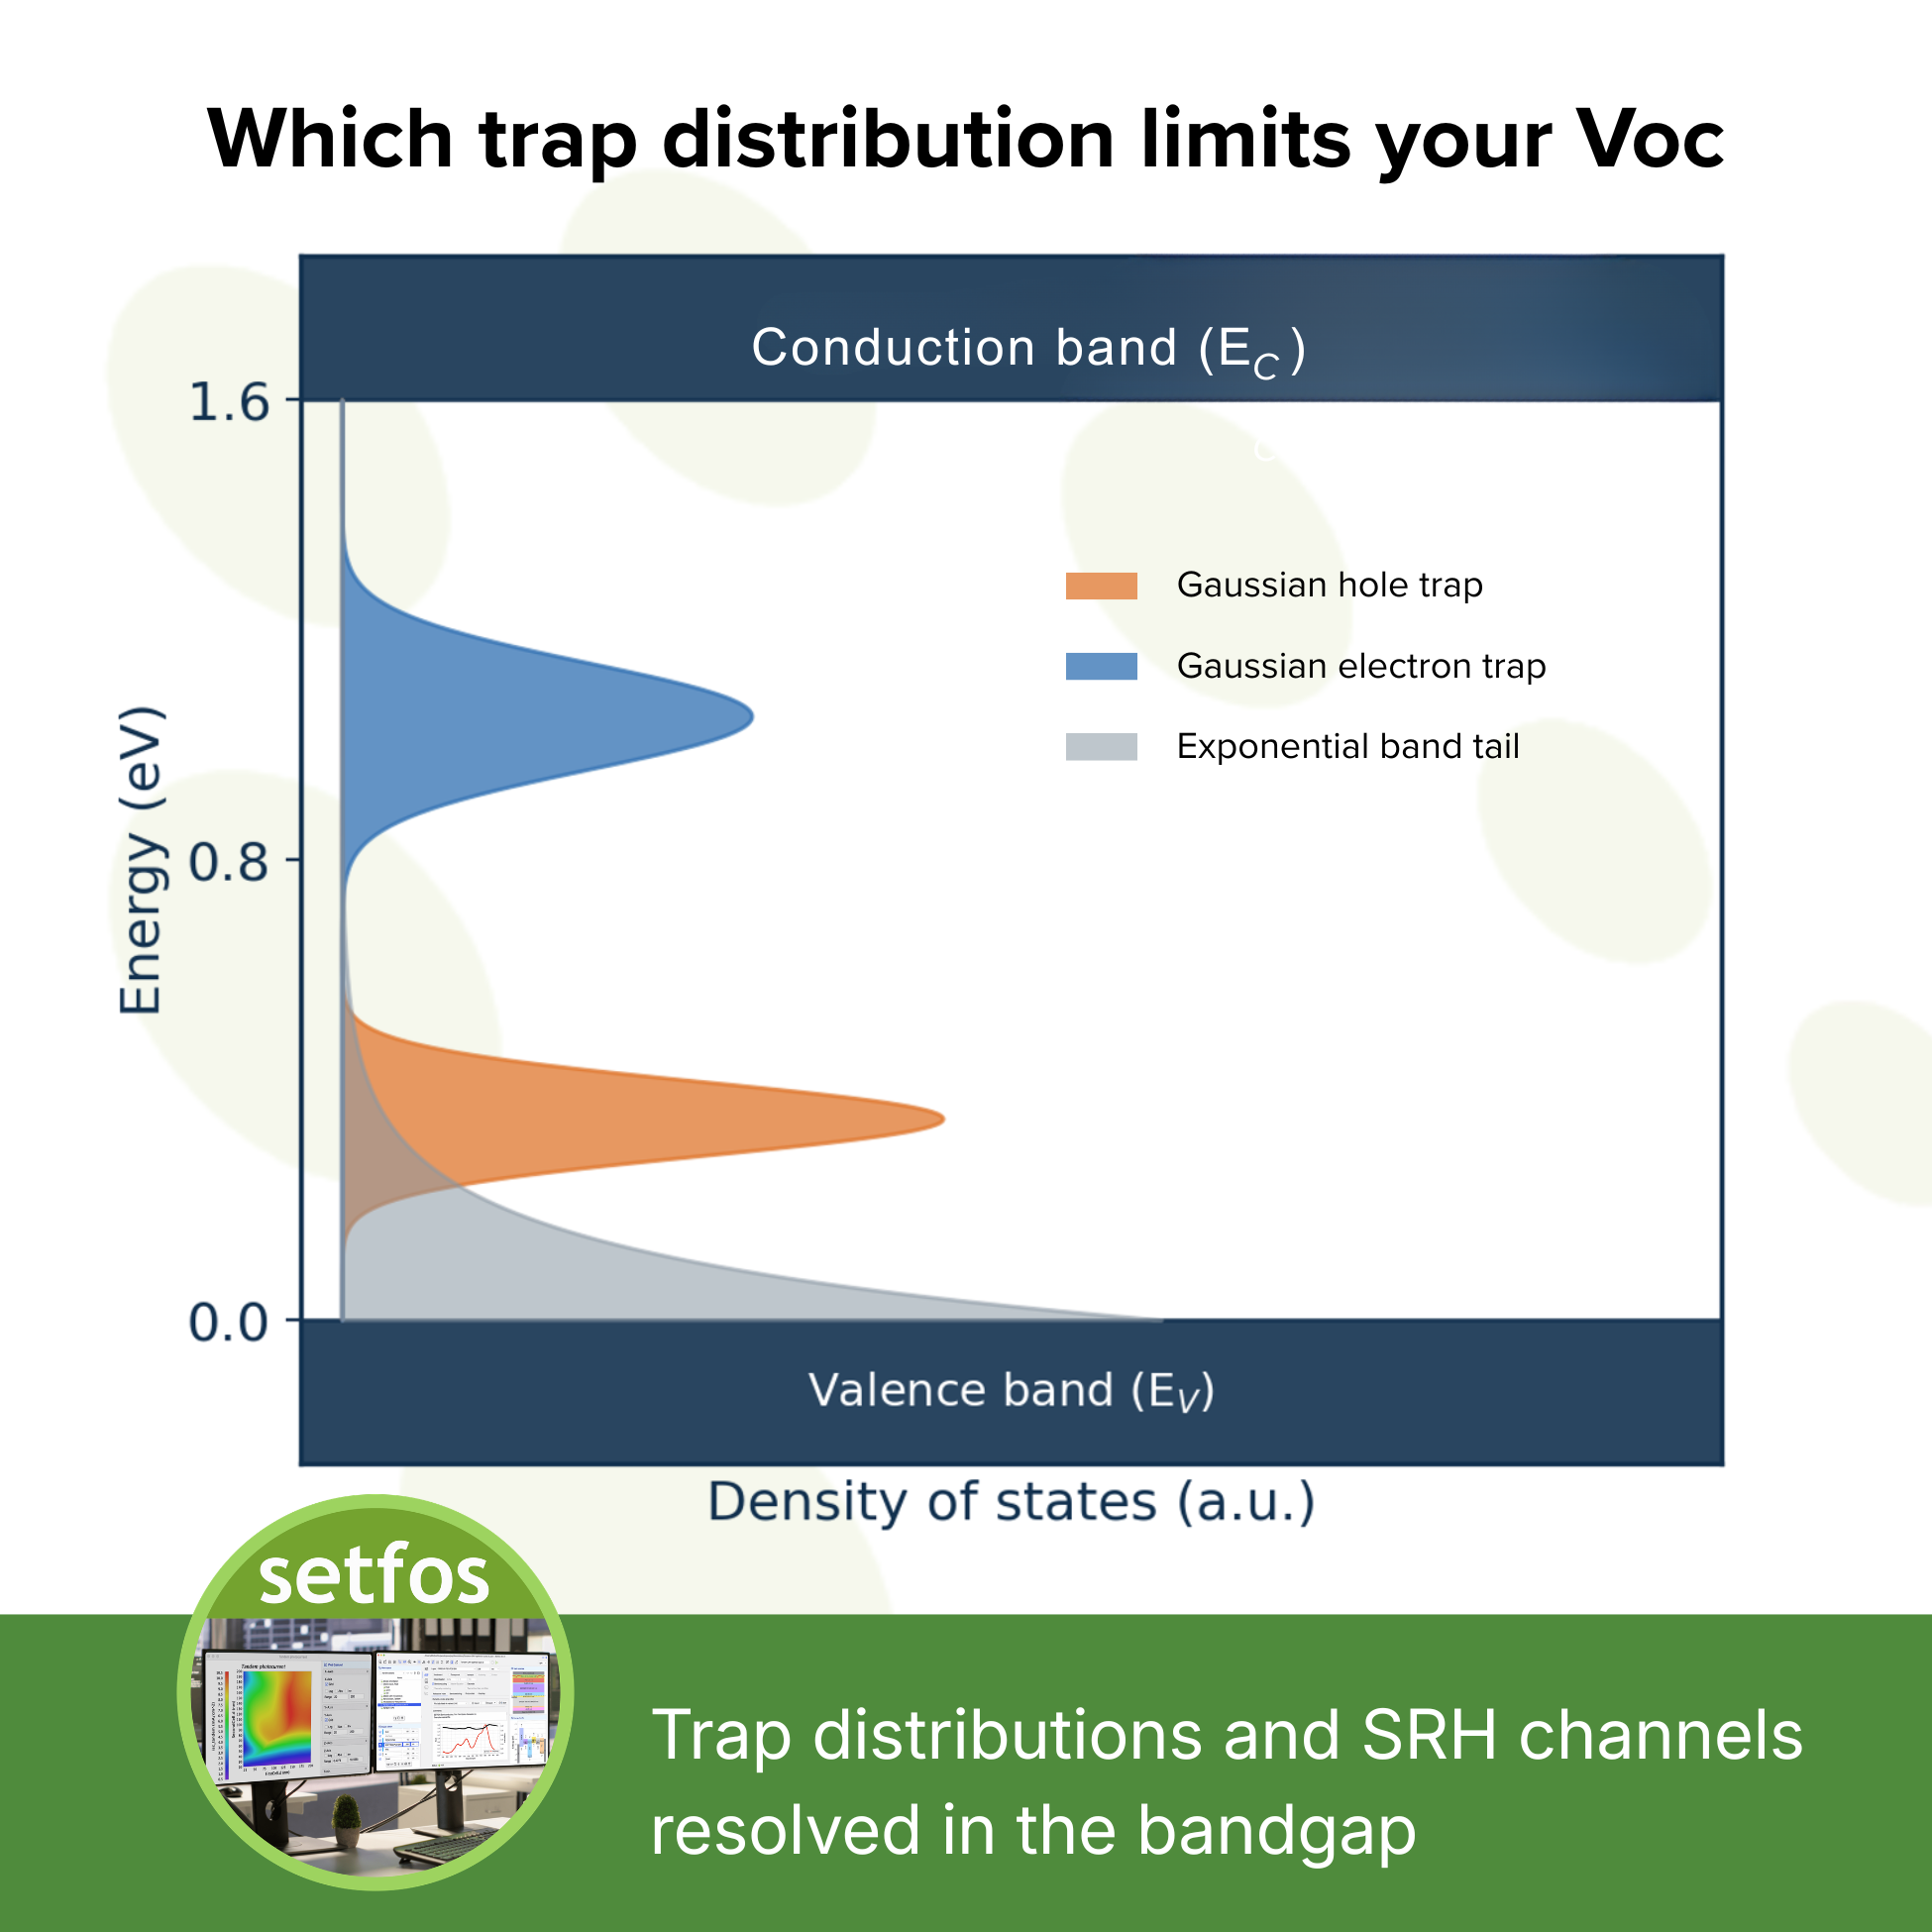
Setfos identifies where recombination losses occur by resolving each recombination channel separately across the bulk, the interfaces, and the transport layers. Most perovskite papers attribute a low open-circuit voltage to non-radiative recombination without locating it.
You can define arbitrarily many trap states per layer. Each trap can be single-level, Gaussian, or exponential in distribution, and each can interact with the valence band, the conduction band, or both, giving a full Shockley-Read-Hall channel. Radiative, Auger, and trap-to-trap recombination are resolved separately.
Fit measured JV, luminescence, and transient data, and the simulation shows whether losses sit in the bulk, at the interfaces, or in the transport layers. That is the difference between saying you optimised the passivation and knowing why it worked.
Why do forward and reverse JV scans give different curves
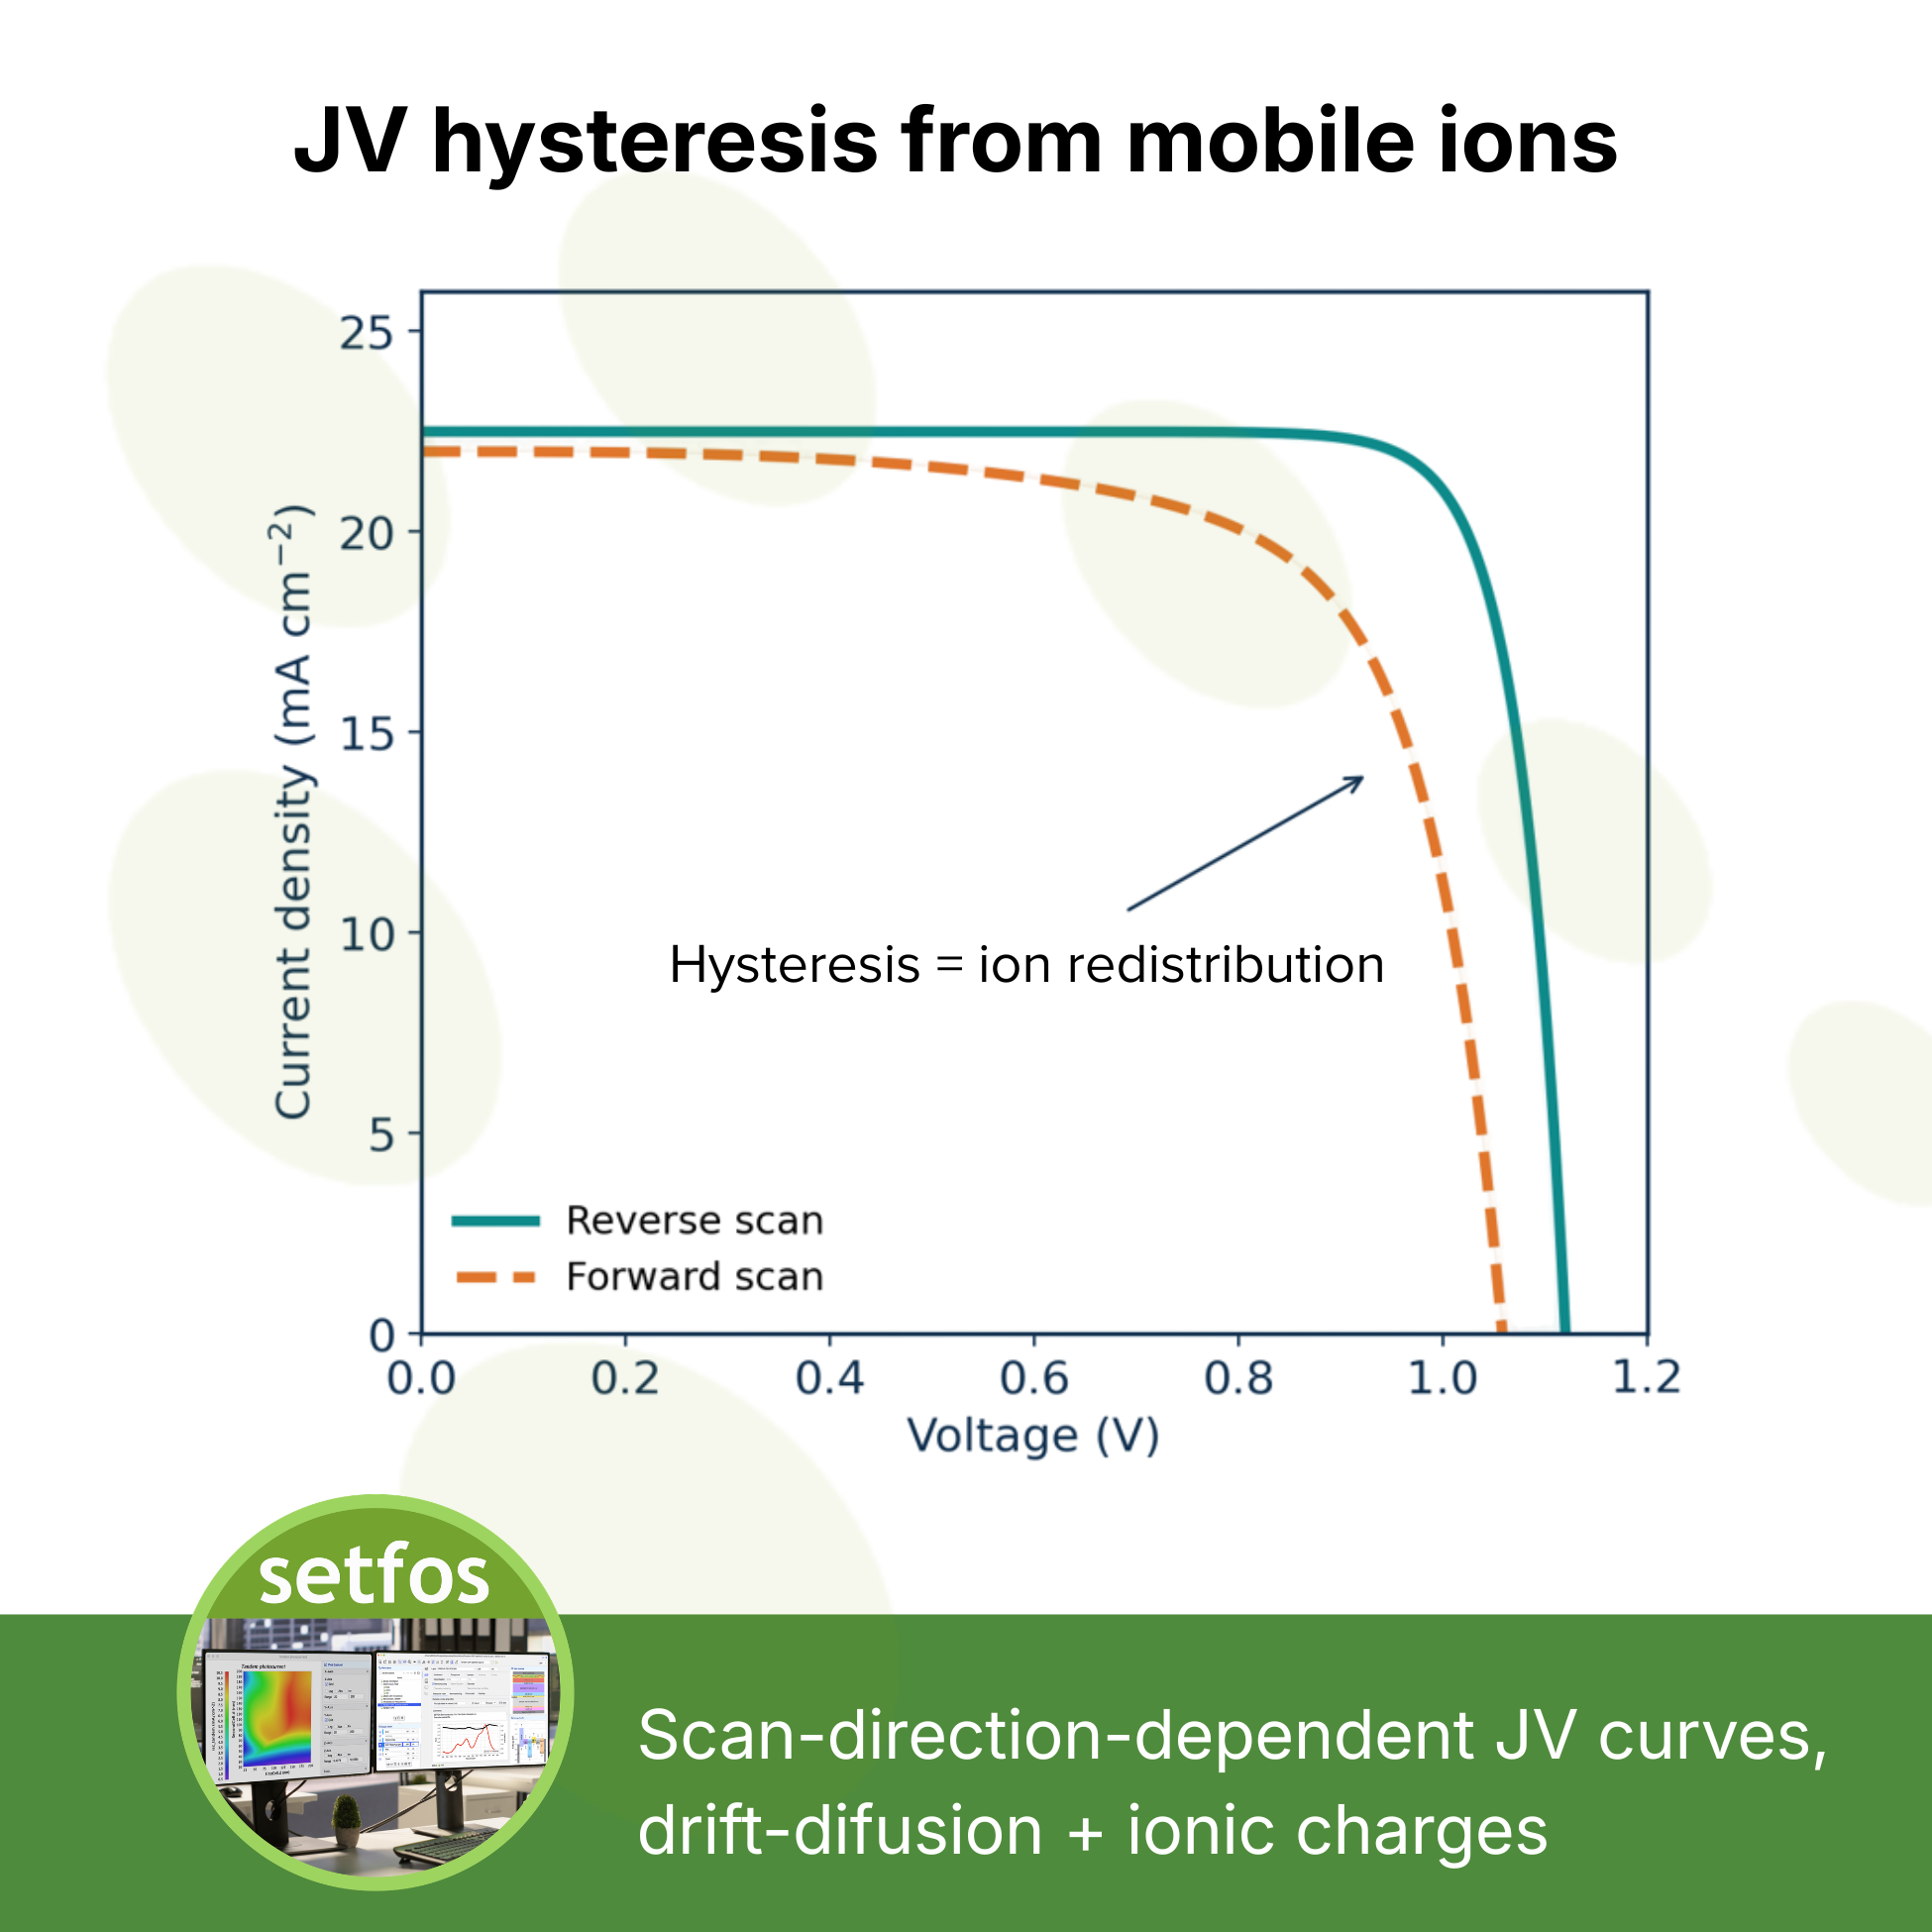
JV hysteresis in perovskite solar cells is caused by mobile ionic charge redistributing the internal electric field during a voltage scan. Setfos couples mobile ions directly into the drift-diffusion solver, so scan-rate-dependent JV curves can be simulated and the underlying ion density and ion mobility extracted.
Scan a perovskite cell forward and backward and you get two different JV curves. That is only a problem if you cannot explain it. With a fitted model you report hysteresis as a quantified ionic property of the device rather than as a measurement artifact.
How do you interpret impedance spectra of perovskite devices
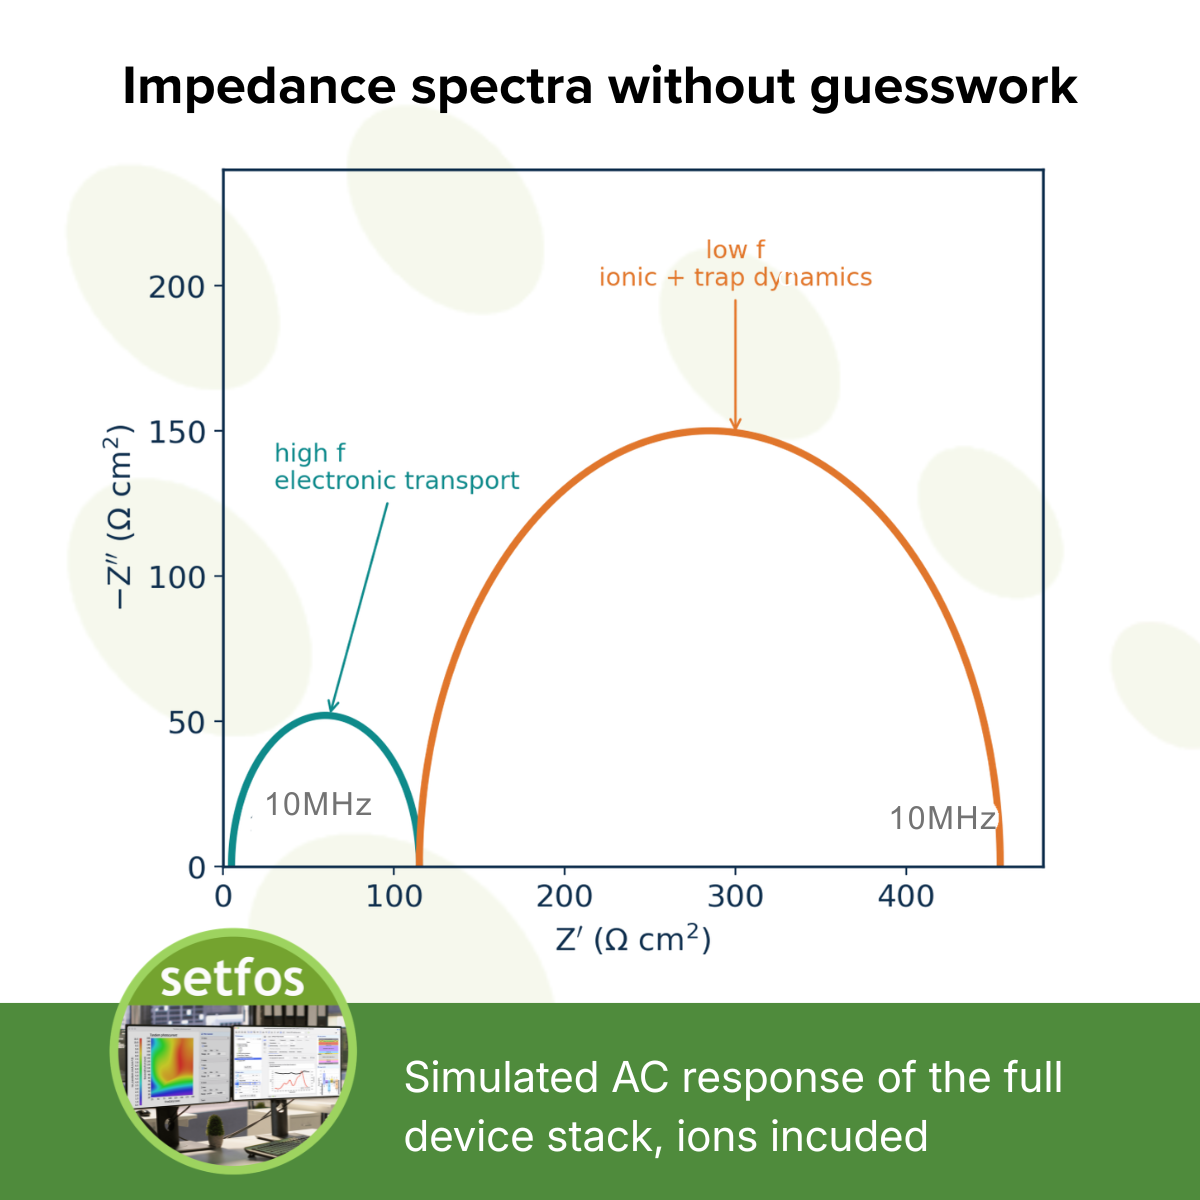
Setfos simulates the full small-signal AC response of a device stack, including mobile ions and trap dynamics, so an impedance spectrum can be reproduced from a physical model instead of fitted to an assumed equivalent circuit.
Impedance spectroscopy on perovskites is hard to interpret. Giant low-frequency capacitance, negative capacitance, and inductive loops all have several competing explanations in the literature. Setfos also covers IMPS and IMVS, the current and voltage response to modulated illumination.
Simulate the spectrum, compare it with your measurement, and the question of which equivalent circuit is correct stops being a question.
What does it take to make a stability claim meaningful
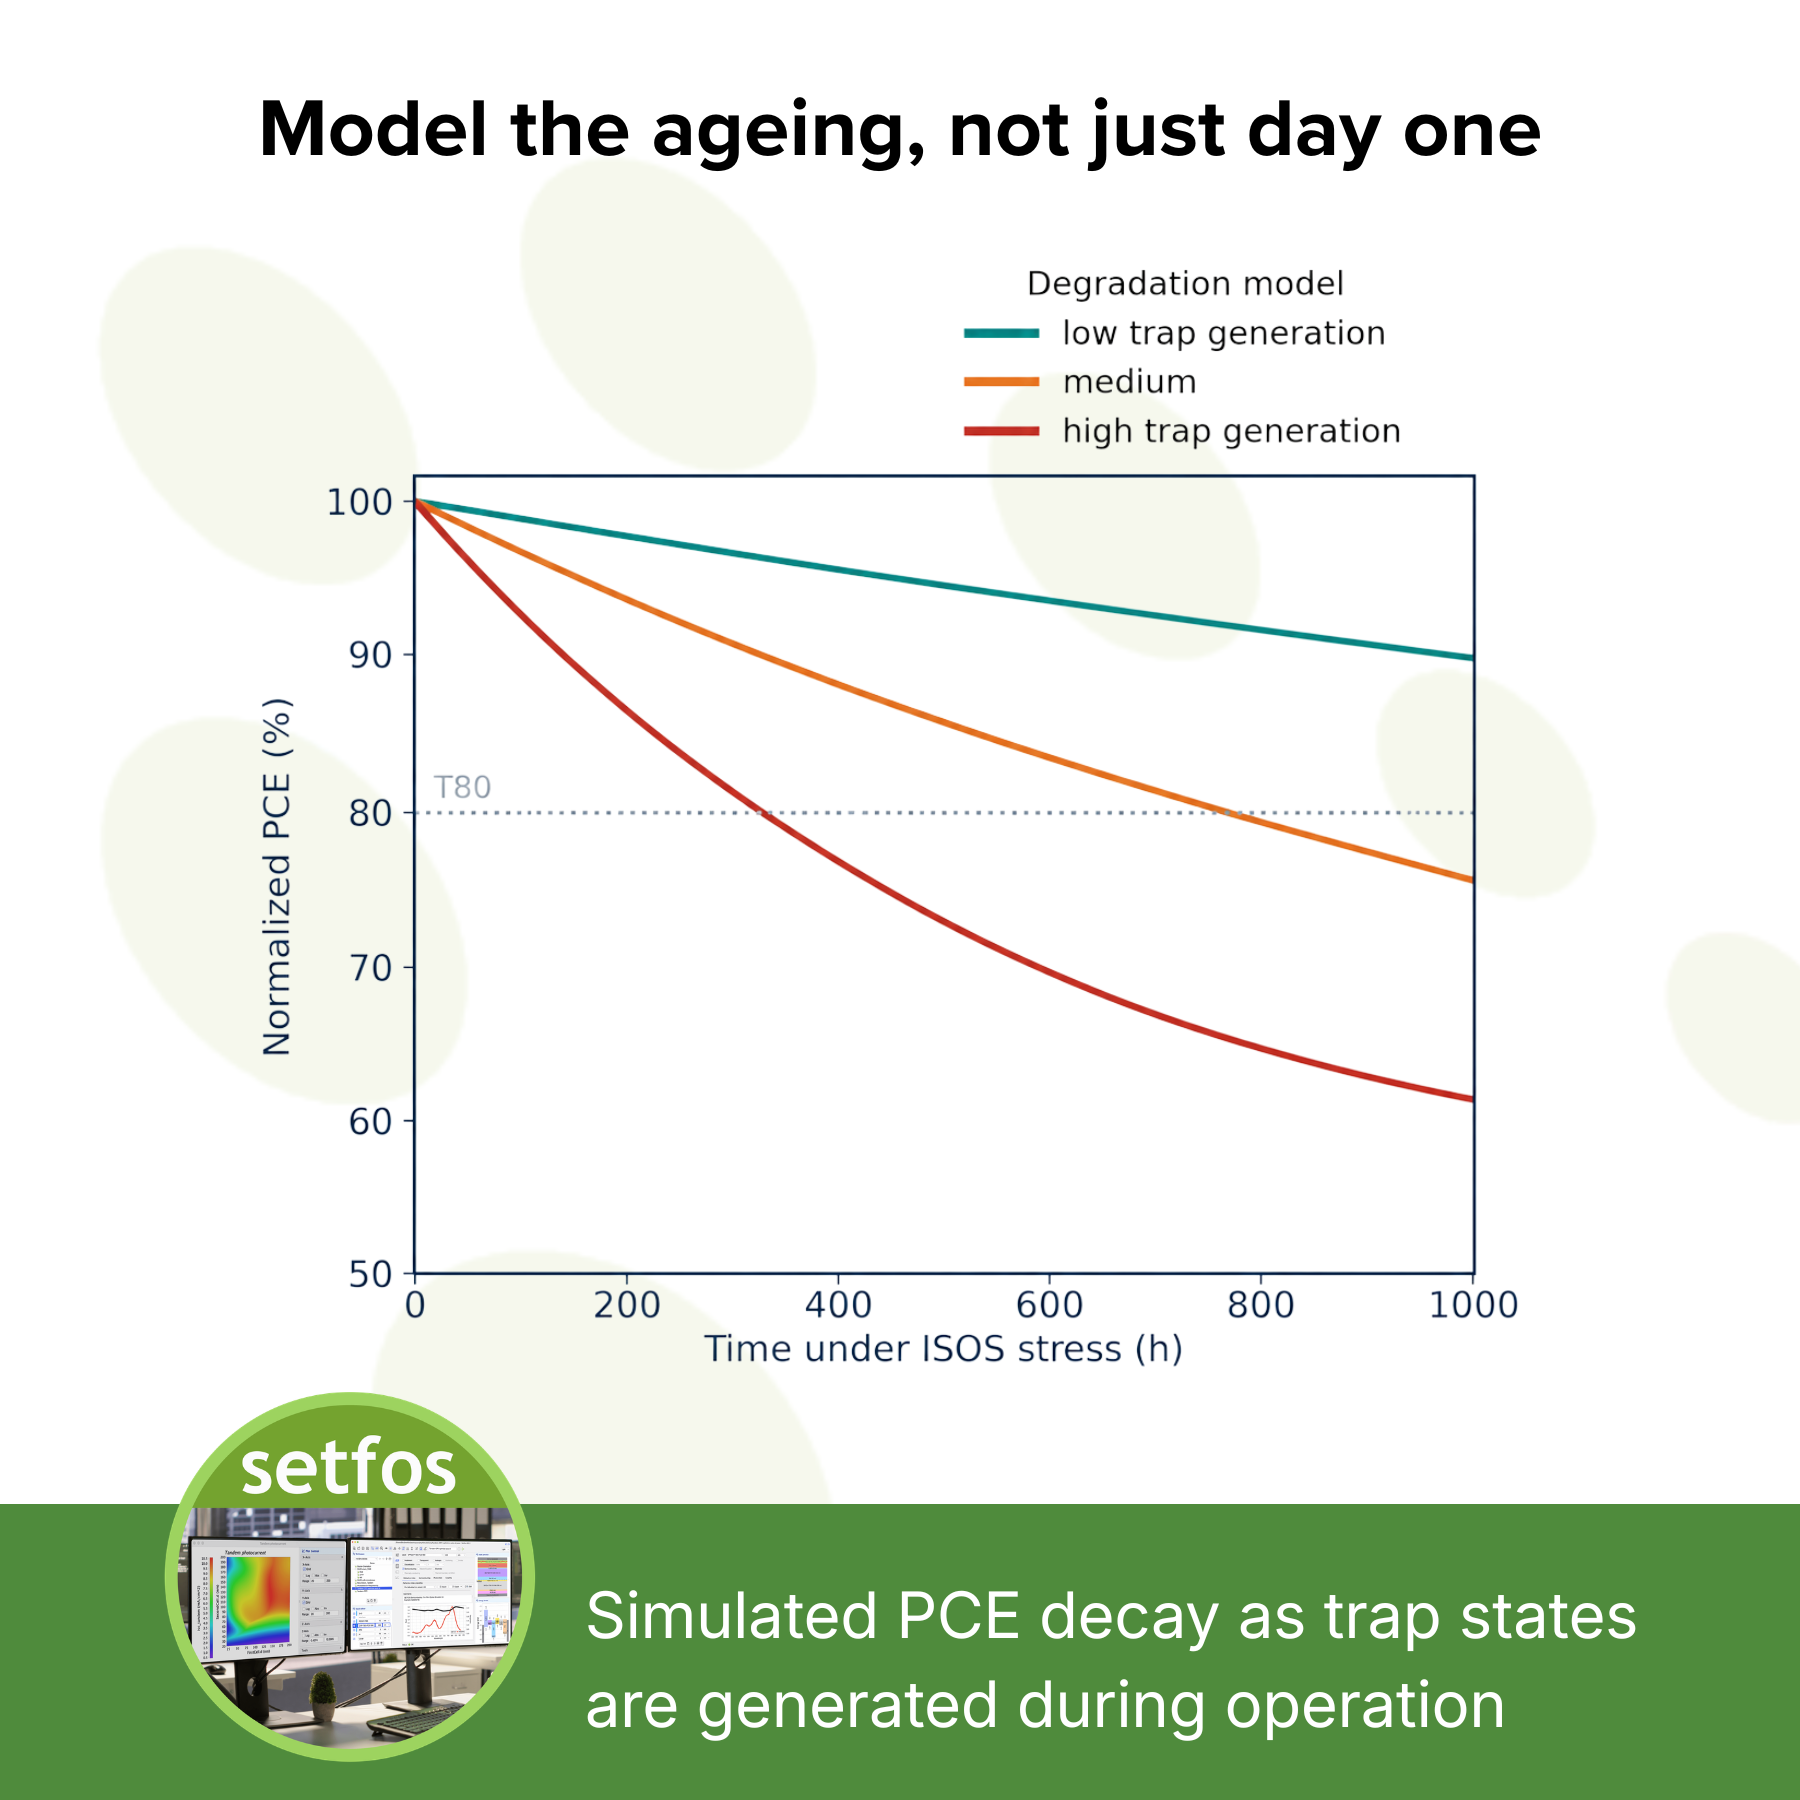
A stability result needs the ISOS protocol it was measured under and a physical account of what degraded. Setfos includes a degradation model in which trap states are generated over time during operation, so a growing defect density can be linked to the measured change in JV curves and transient response.
'The device retained 90% of its initial PCE after 1000 hours' is incomplete on its own. Under which ISOS protocol, and what physically degraded?
Pair the simulation with a structured ISOS testing plan. Litos Lite is built for that, with controlled light, temperature, and electrical bias over long test runs.
How do you decide which device to fabricate next
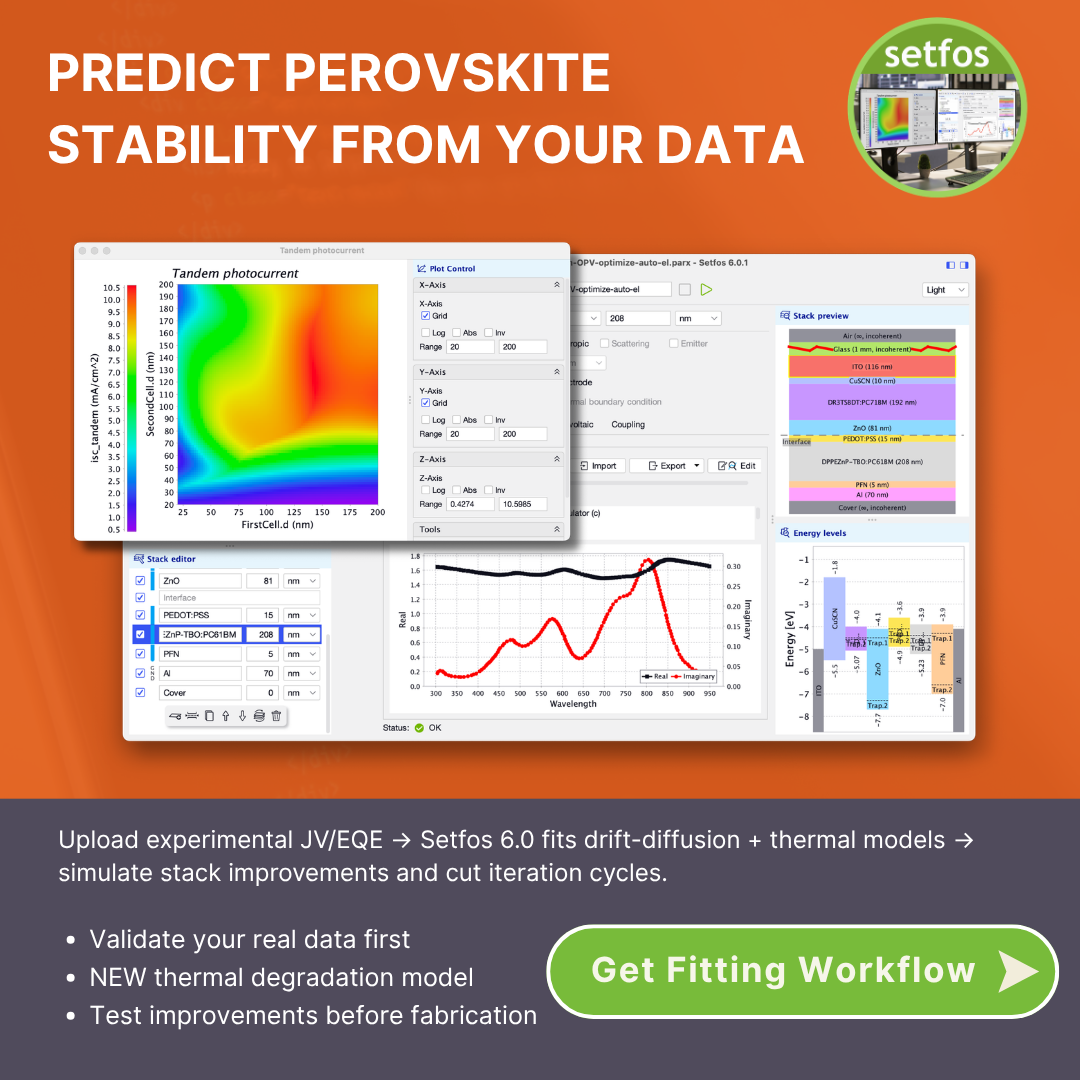
Fit a combined optical and drift-diffusion model to measured JV and EQE data, include ionic and thermal effects where relevant, then test stack changes in simulation before fabrication. Perovskite stability research still needs experiments. The point is that the next experiment can be better informed.
Setfos is not a black box and not a shortcut around real data. It is a more physics-based way to decide what to try next.
Which Setfos capability answers which question
| Research question | Modelled in Setfos | Validate against |
|---|---|---|
| Where Voc losses originate | Arbitrary trap distributions per layer, full SRH, radiative, Auger, trap-to-trap | JV, luminescence, transients |
| Cause of JV hysteresis | Mobile ionic charge in the drift-diffusion solver | Scan-rate-dependent JV |
| Meaning of an impedance feature | Small-signal AC response of the full stack, IMPS, IMVS | Impedance spectra, IMPS, IMVS |
| What degrades during operation | Trap generation over time as a degradation model | ISOS ageing data |
| Effect of a stack change | Coupled optical and drift-diffusion model, ionic and thermal effects | JV, EQE |
Frequently asked questions
Can Setfos simulate perovskite solar cells with mobile ions
Yes. Setfos couples mobile ionic charge directly into the drift-diffusion solver, which allows simulation of scan-rate-dependent JV curves, hysteresis, and the low-frequency features that ions produce in impedance spectra.
What trap distributions can Setfos model
Setfos supports arbitrarily many trap states per layer. Each can follow a single-level, Gaussian, or exponential distribution and can interact with the valence band, the conduction band, or both, forming a complete Shockley-Read-Hall recombination channel.
Does Setfos simulate impedance spectroscopy
Yes. Setfos calculates the small-signal AC response of the full device stack, including mobile ions and trap dynamics. It also simulates IMPS and IMVS, the current and voltage response to modulated illumination.
Can Setfos model device degradation over time
Setfos includes a degradation model in which trap states are generated during device operation. This allows the effect of a growing defect density on JV curves and transient responses to be simulated and compared with measured ageing data.
What measurement data do you need to fit a Setfos model
A typical workflow starts from measured JV and EQE data. Luminescence, transient, and impedance measurements further constrain the fit and are needed to separate recombination channels with confidence.
How does Setfos relate to ISOS stability testing
ISOS protocols define the stress conditions under which stability is measured. Setfos models the physical degradation behind the measured decay. Fluxim's Litos Lite provides the controlled light, temperature, and electrical bias needed to run ISOS test sequences.
Who develops Setfos
Setfos is developed by Fluxim AG, a Swiss company producing simulation software and measurement instruments for OLED, photovoltaic, display, and battery research.
Try Setfos on your own data
The fitting workflow is documented step by step, and our application scientists will help you set up your first stack.
Request a Setfos trial