
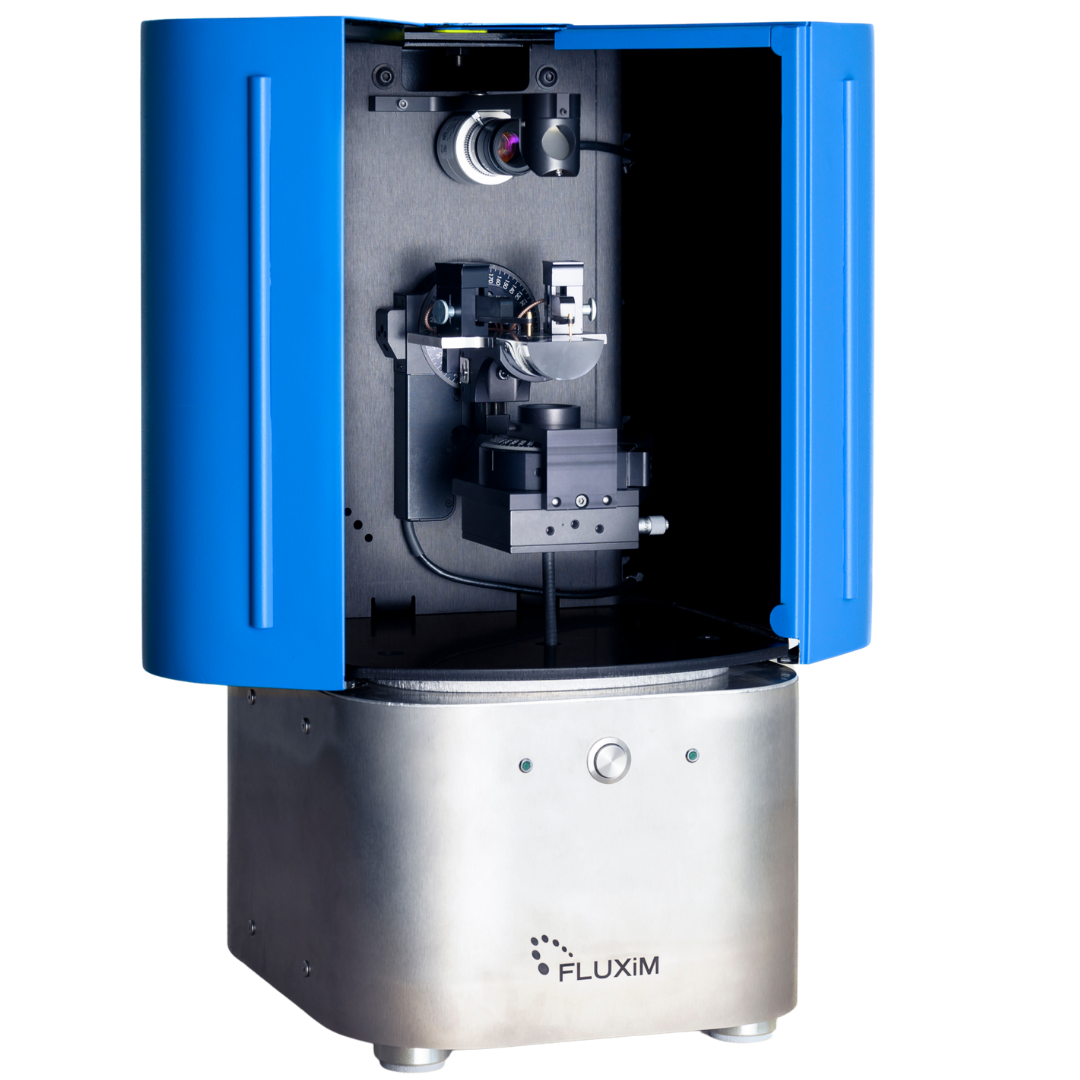
Phelos
Measure how your OLED or thin-film LED really emits

Phelos helps researchers move beyond forward-only emission measurements by capturing the full angular, spectral, and polarization behaviour of OLEDs, PeLEDs, quantum-dot LEDs, and emissive thin films.
Gonio-Spectrometer for Angle-Dependent EL & PL Measurements
Phelos captures angle- and polarization-resolved EL and PL spectra to help researchers quantify emission profiles, color shift, dipole orientation, IVL characteristics, EQE-related metrics, and optical outcoupling behavior in OLEDs, PeLEDs, quantum-dot LEDs, and emissive thin films.
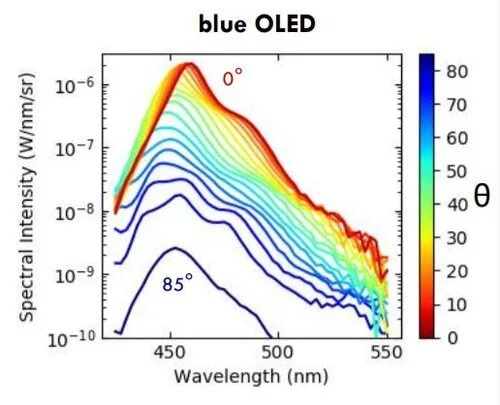
Why angle-resolved EL and PL matter
Thin-film LEDs rarely emit as ideal Lambertian sources. OLEDs, PeLEDs, and quantum-dot LEDs can show strong angular changes in intensity, spectrum, color, and polarization. A forward luminance measurement alone may therefore miss important optical information.
With Phelos, researchers can measure:
angular emission spectra
spectral shift with viewing angle
s- and p-polarized emission
dipole orientation in emissive thin films
IVL, EQE, power efficiency, luminous efficacy, CIE coordinates, CRI, and color temperature
datasets for optical modeling and Setfos parameter extraction (emission zone)
The Phelos measurements can be easily exported to the powerful simulation software Setfos for data analysis, parameter extraction, and device modeling.
Trusted by industry and academia, Phelos measurements have substantially contributed to numerous scientific publications.
Phelos Review
“Phelos angle-dependent photoluminescence (PL)/electroluminescence (EL) spectrometer along with Setfos package is a great combination of hardware and software to characterize the orientation of emission transition dipole moment.
User-friendly interface and a broad range of parameters, such as polarization angles, position angles, driving current, and J-V parameters to investigate the PL as well as EL characteristics of light-emitting semiconductors.
We have extensively used both Phelos and Setfos to understand the quantum emission characteristics of perovskites and organometallic complexes and light-extraction efficiency in PeLEDs and OLEDs. We found these tools allowed fast data acquisition, simulation, and in-depth understanding of emission characteristics of LEDs and OLEDs.”
Dr. Sudhir Kumar, Nanomaterials Engineering Research Group, Institute for Chemical and Bioengineering, ETH Zürich


Key advantages of Phelos
Angle-resolved EL and PL in one instrument
Characterize light-emitting devices and emissive thin films without switching between separate setups.Measure non-Lambertian emission directly
Capture angular intensity and spectral changes instead of relying on simplified forward-emission assumptions.Polarization-resolved spectroscopy
Measure s- and p-polarized emission or sweep continuously over polarization angles.Dipole orientation analysis
Extract emitter orientation in organic, perovskite, quantum-dot, and hybrid light-emitting thin films.Device-level IVL and efficiency metrics
Acquire IVL curves and calculate EQE-related quantities, lm/W, cd/A, CRI, CIE coordinates, and color temperature.Top- and bottom-emitting LED compatibility
Analyze a broad range of OLED, PeLED, and thin-film LED architectures.Combine with Setfos
Connect experimental angular spectra with optical simulation, parameter extraction, and device modelling.
Complement total-flux measurements with angular insight
Integrating spheres are useful for total flux measurements, but they do not show how emission intensity, spectrum, color, or polarization changes with viewing angle. Phelos adds this missing angular information, helping researchers understand non-Lambertian emission, color shift, outcoupling effects, and display-relevant viewing-angle behavior.
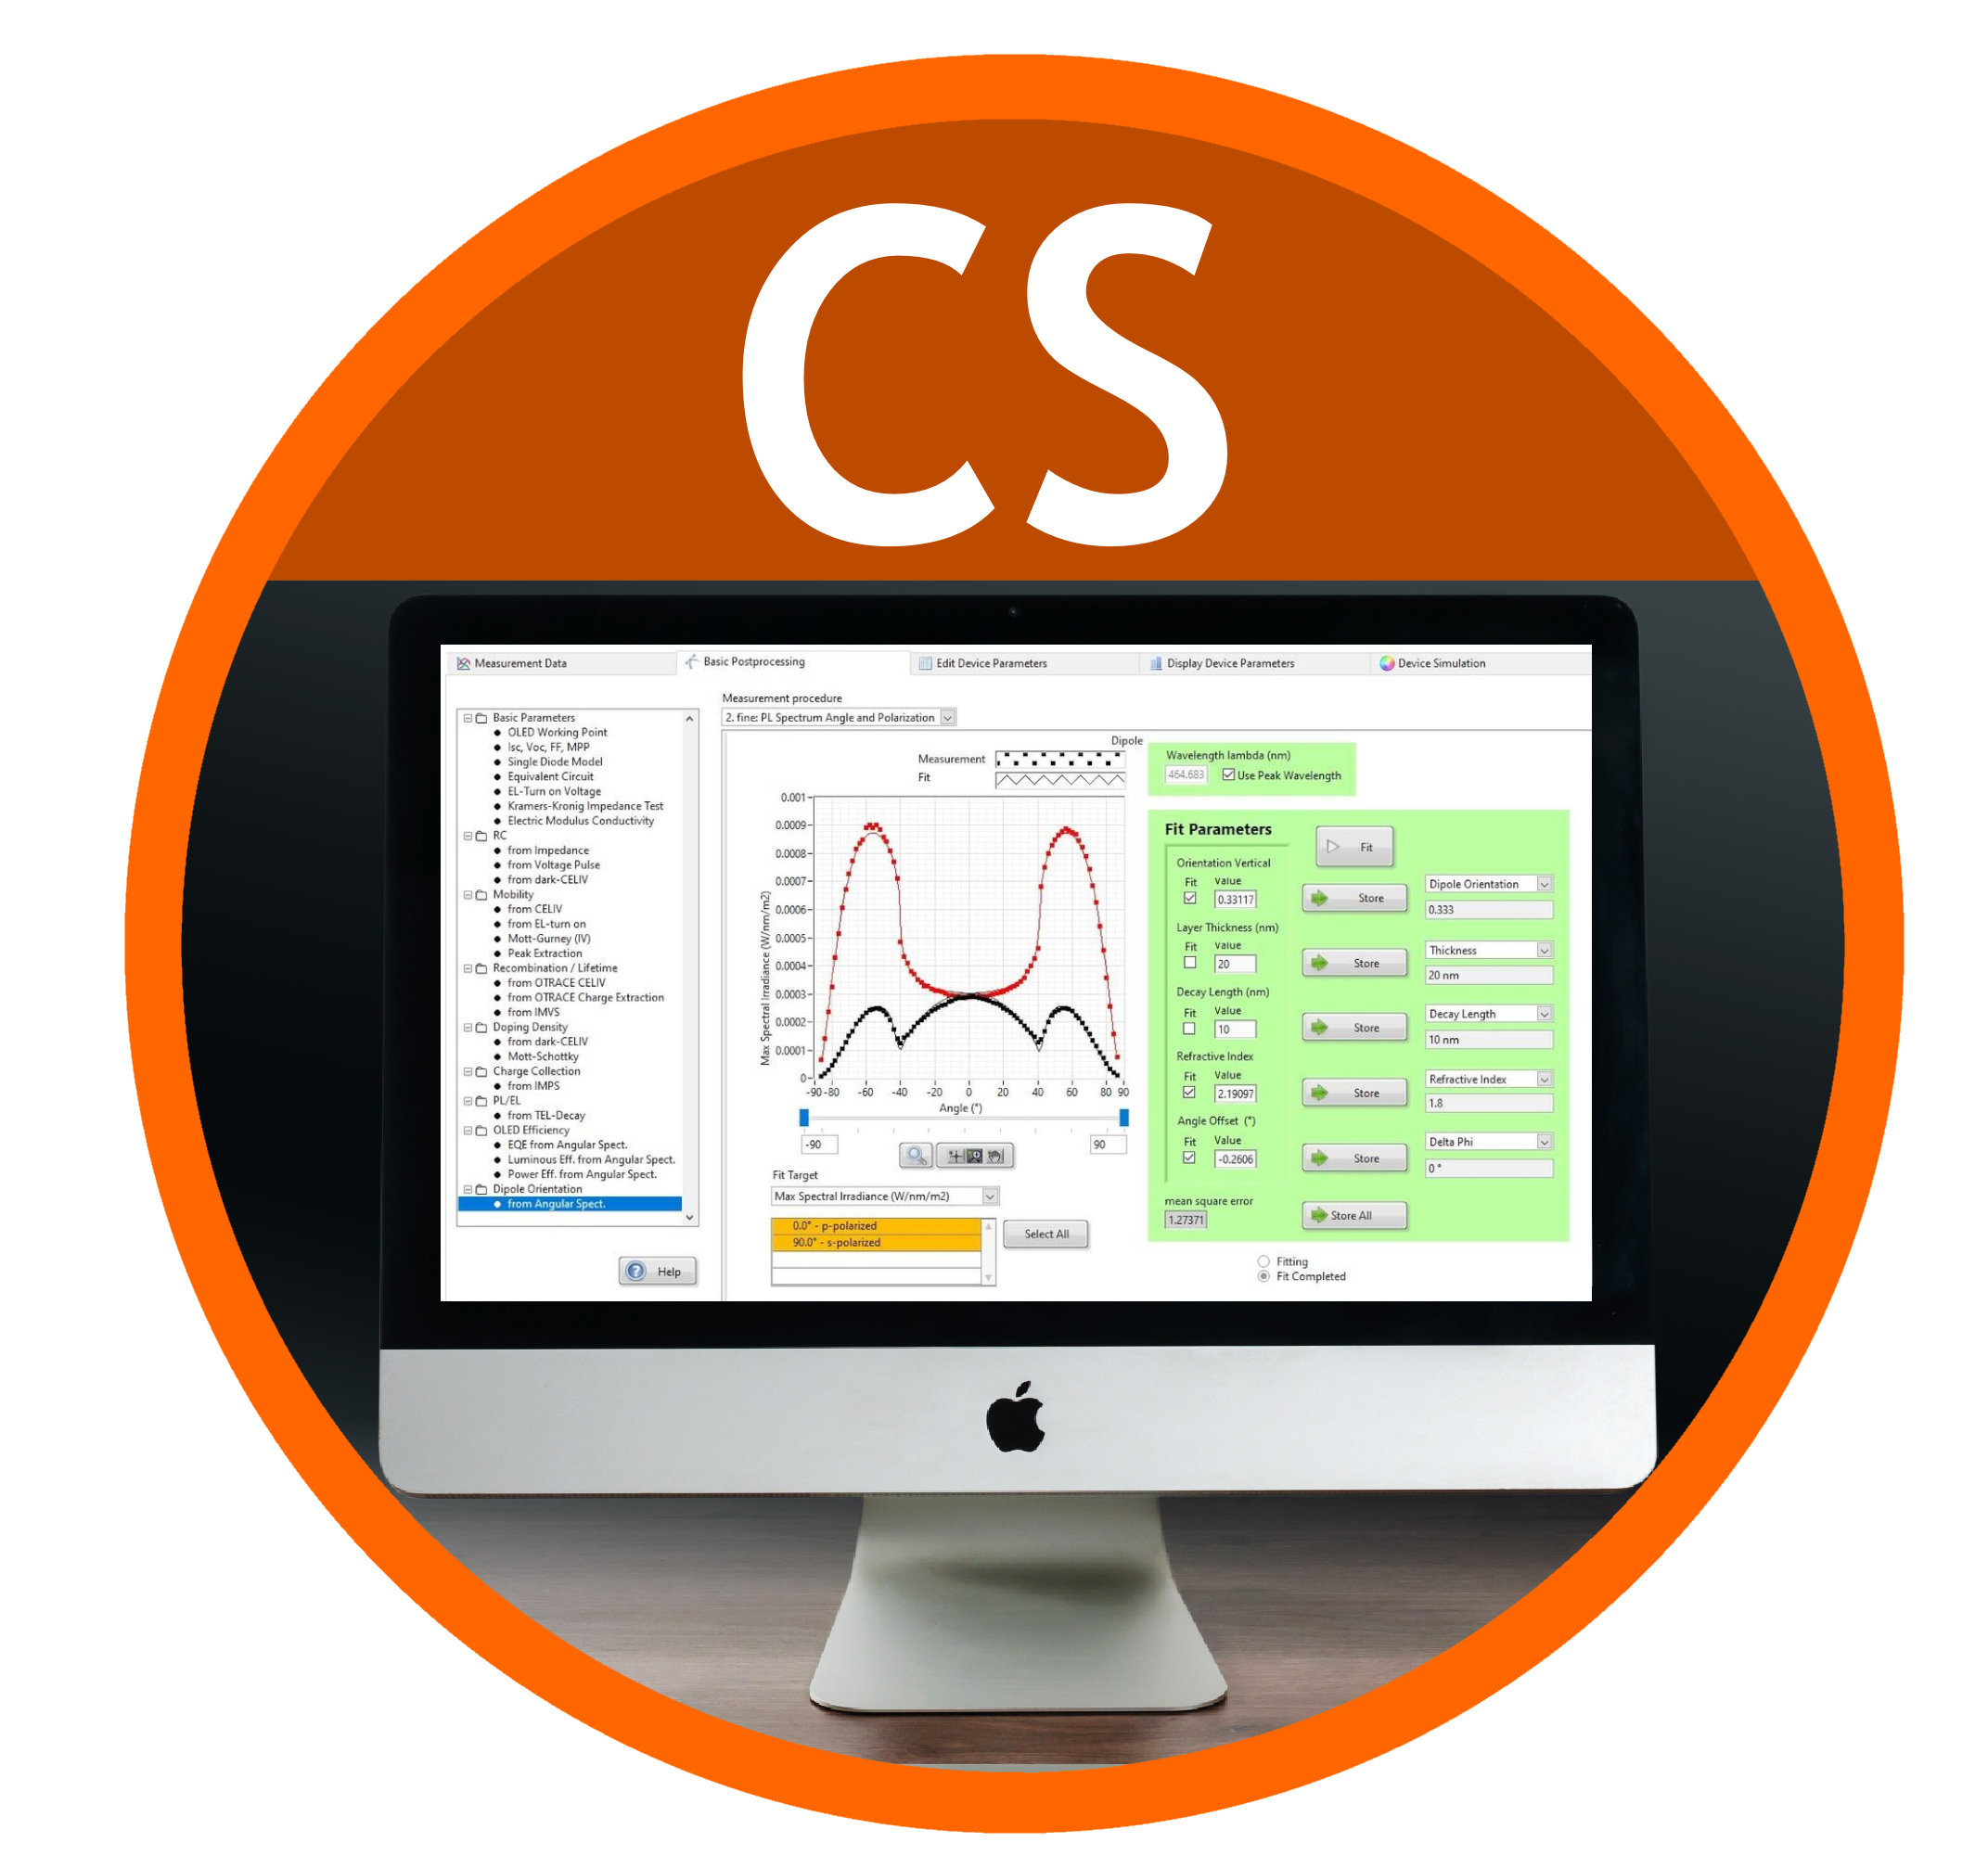
Characterization Suite (CS) Software
Phelos is operated via the Characterization Suite (CS), Fluxim’s integrated platform for instrument control, data acquisition and analysis. CS guides the optical alignment of the sample and enables precise configuration of angular- and spectral-resolved measurements, with predefined as well as customizable acquisition protocols. Researchers can visualize results in real time, extract key parameters such as emission profiles and angular intensity distributions, and directly compare datasets of different samples. The integrated postprocessing routines allow users to determine the dipole orientation of emissive thin-films as well as the efficiency of LEDs. Combination with simulation tools like Setfos further enables the validation of optical models against measured data, as well as determination of the emission zone / emitting dipole distribution in LEDs, complementing the workflow for characterizing and optimizing optoelectronic devices.

Interested in Phelos?
QUESTIONS FIRST?
Talk to Dr. Markus Regnat our Phelos Expert
Email: info@fluxim.com
Tel: +41 44 500 47 70

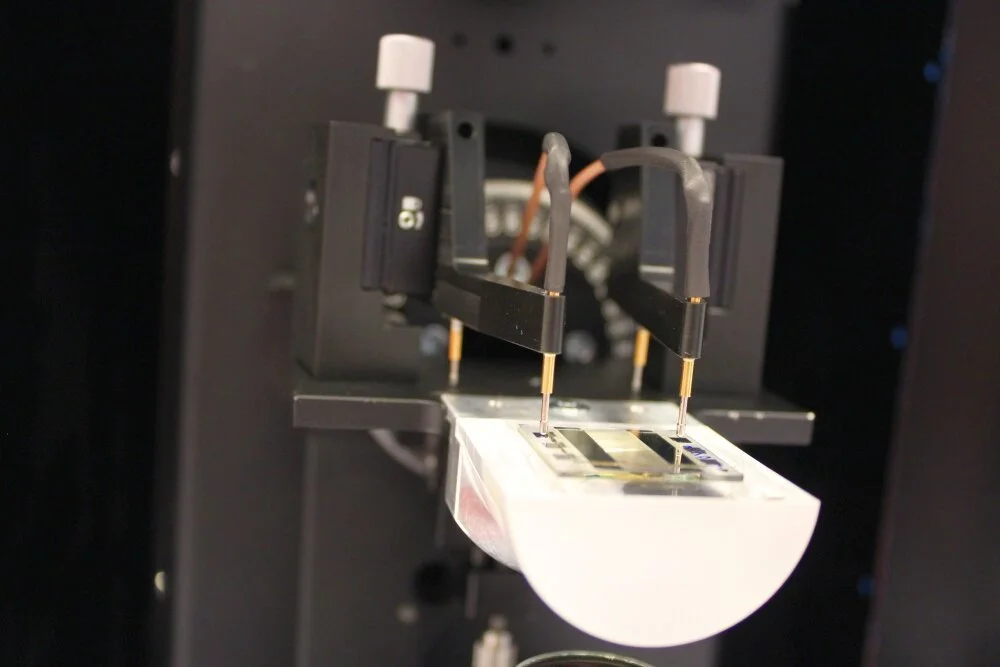
Different Operation Modes
Phelos is a spectrometer for both Photoluminescence and Electroluminescence measurements. The instrument is equipped with an internal SMU that is used alternatively for the EL or PL characterization.
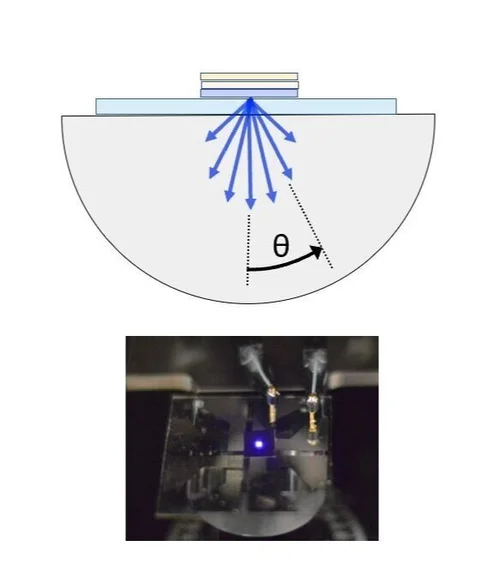
OLED and PeLED device characterization
Measure angular EL spectra, viewing-angle behavior, color shift, IVL curves, EQE-related metrics, cd/A, lm/W, CIE coordinates, CRI, and color temperature.
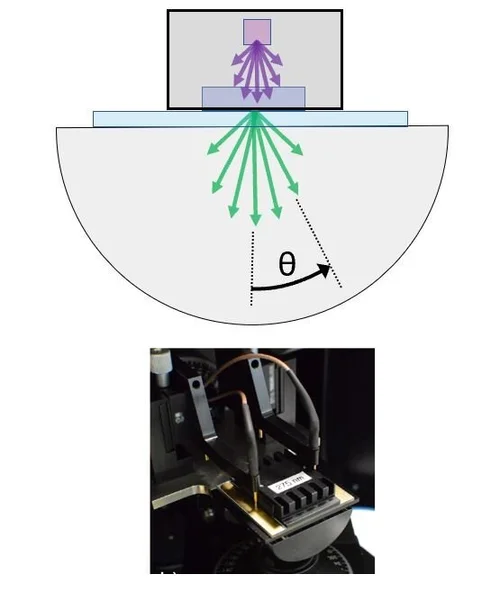
Emissive thin-film analysis
Use angle- and polarization-resolved PL to study emitter orientation, optical anisotropy, and emission behaviour in organic, perovskite, quantum-dot, and hybrid thin films.
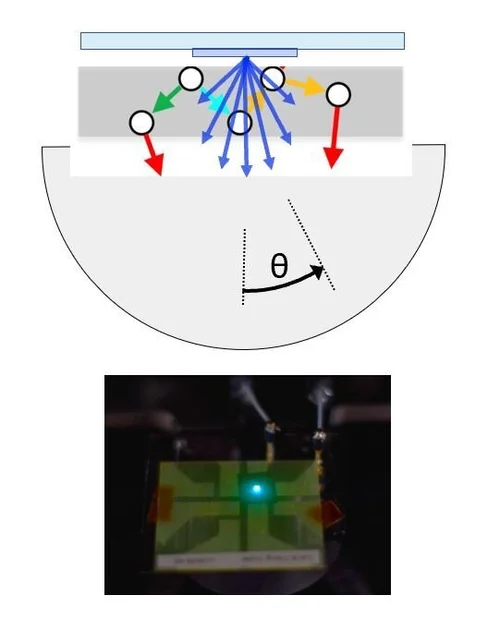
Optical model validation
Compare measured angular spectra with Setfos simulations to validate layer stacks, emitter orientation, emission-zone position, and outcoupling models.
Post-processing of Experimental Data
Post-processing of experimental data
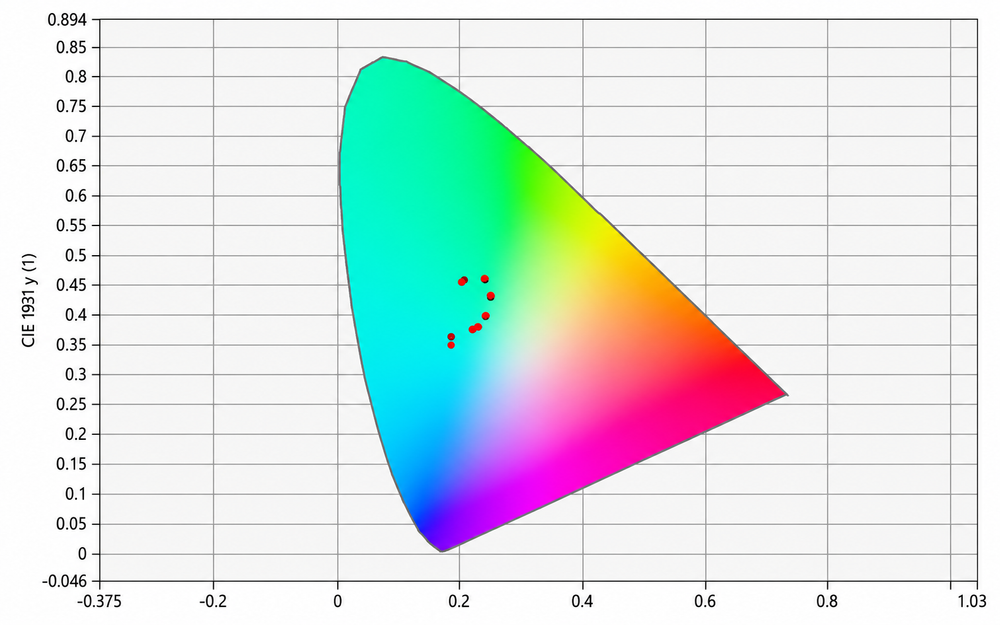
Extract key device metrics directly from measured EL and IVL data, including working point, luminous efficacy, colour coordinates, colour temperature, and CRI.
- Working point
- Efficacy cd/A
- CIE coordinates
- Colour temperature
- CRI and further colour metrics

Radiometric and photometric analysis
Convert measured angular spectra into quantitative radiometric and photometric outputs for OLED, PeLED, and thin-film LED characterization.
- Spectral irradiance and spectral intensity
- Radiance and radiant intensity
- Luminous intensity
Fluxim’s R&D Tools and expertise are trusted by Academia and Industry


Phelos Software
The Characterization Suite software provided with Phelos is an all-in-one platform to characterize your samples and analyze your data. The Graphical User Interface (GUI) allows you to extract easily the orientation of the dipoles in your light-emitting film with an automated fitting routine.
For LEDs the integration of the spectra over all angles allows to determine EQE, luminous efficacy and power efficiency.
Phelos Specifications
| Photoluminescence and Electroluminescence | |
|---|---|
| Angular Range | -90° to +90°, top and bottom emission |
| Optical Resolution | < 0.5° |
| Spectral Range | 360 to 1100 nm * |
| Spectral Resolution | 2.5 nm * |
| Signal-to-noise ratio | 300:1 |
| Voltage Range | ± 20 V |
| Current Range | ± 120 mA |
| Minimal Resolvable Current | < 100 pA |
| Motorized Polarizer | 0 to 360° (continuous) |
| Sample stage size | 40 x 40 mm2 |
| PL Illumination Spot Size | 5 x 3 mm2 |
| PL Excitation | 275 nm to 405 nm ** |
| Computer Connection | USB |
| Weight | 18 kg |
| Dimensions | 50 x 29 x 24 cm3 |
| * Smaller spectral range with higher resolution available upon request. ** Default wavelength is 365 nm. Various excitation wavelengths optionally available |
|
We have been using Phelos for our research quite heavily. If you want to understand how to characterize down-converting nanocrystals for displays you can check this page “LIGHT CONVERSION USING PEROVSKITE QUANTUM DOTS”.
We also prepared a tutorial to explain how to use angular resolved photoluminescence and electroluminescence to study organic semiconductors.
Phelos Videos
