Paios Screen Shots

A computer interface screen showing options for adding measurement types for various device types, including light emitting device, photovoltaic device, monopotolar device, and electrochemical device. Selected is CELIV under measurement types, with descriptions for different voltage ramp experiments.

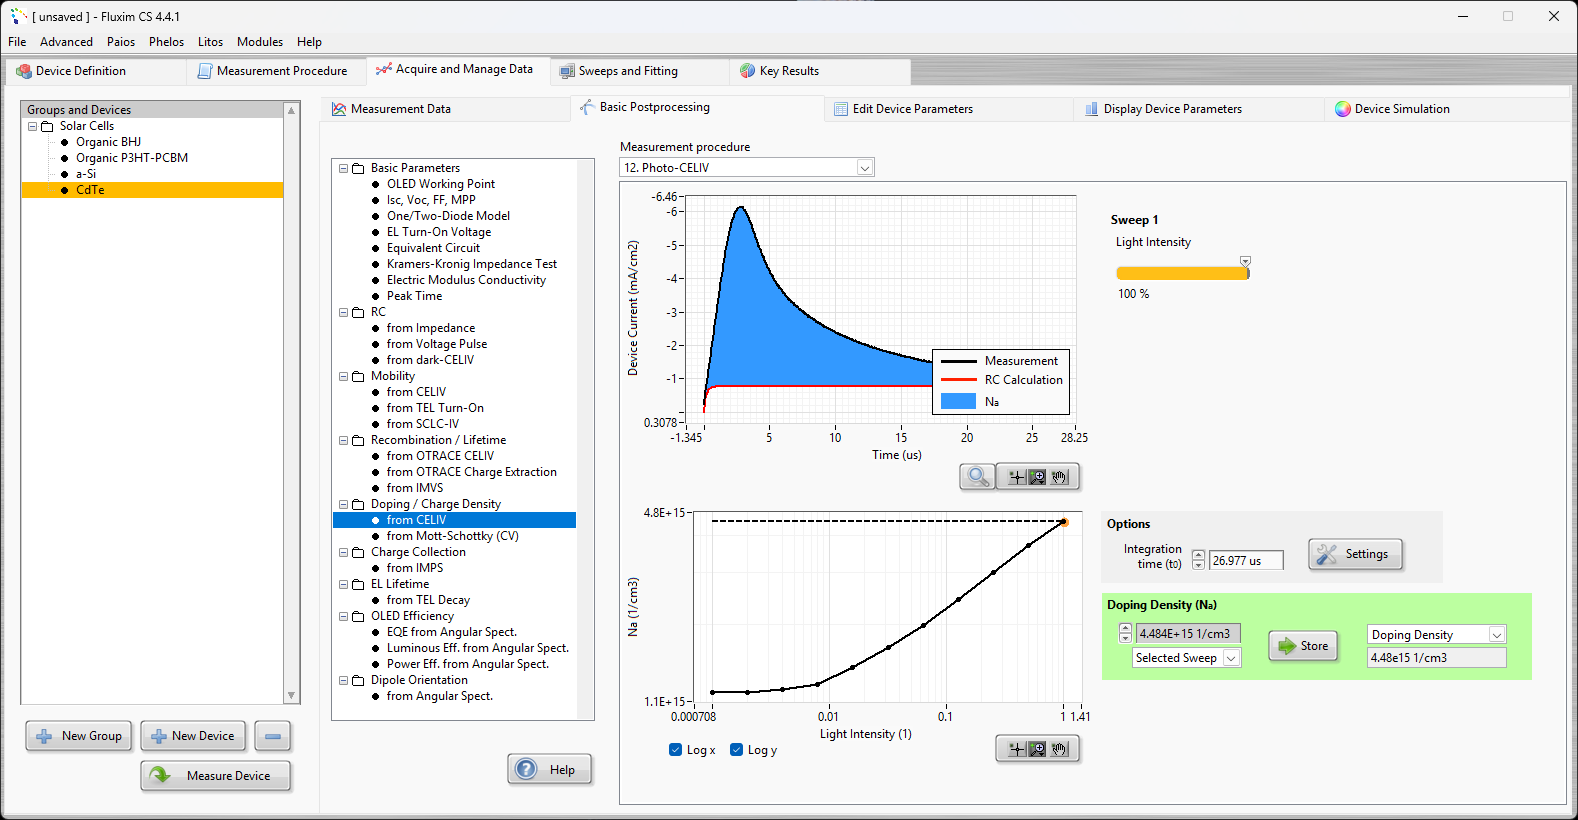
Screenshot of Fluxim CS software interface showing measurement data for a solar cell, specifically a CELIV test measuring device current and sodium ion concentration over time, with options for data analysis and parameter adjustments.

Screenshot of Photovoltaic device measurement software interface displaying graphs of device current versus voltage and light intensity, with parameters such as short circuit current, open circuit voltage, maximum power point, and fill factor.

Screenshot of a signal editor software interface showing variable definitions for light intensity and delay, with two graphs illustrating voltage and illumination over time, and options to define, truncate, and segment signals.

Screenshot of a scientific software interface displaying a bar graph comparing mobility parameters of different solar cell materials, including Organic BHJ, Organic P3HT-PCBM, a-Si, and CdTe.

Screenshot of Fluxim CS software displaying measurement data for a PCB with various electrical and thermal parameters in a table.

Screenshot of Fluxim CS software displaying measurement data of a photovoltaic device at different temperatures, with a graph showing device current versus time in microseconds, and a list of measurement conditions on the left.

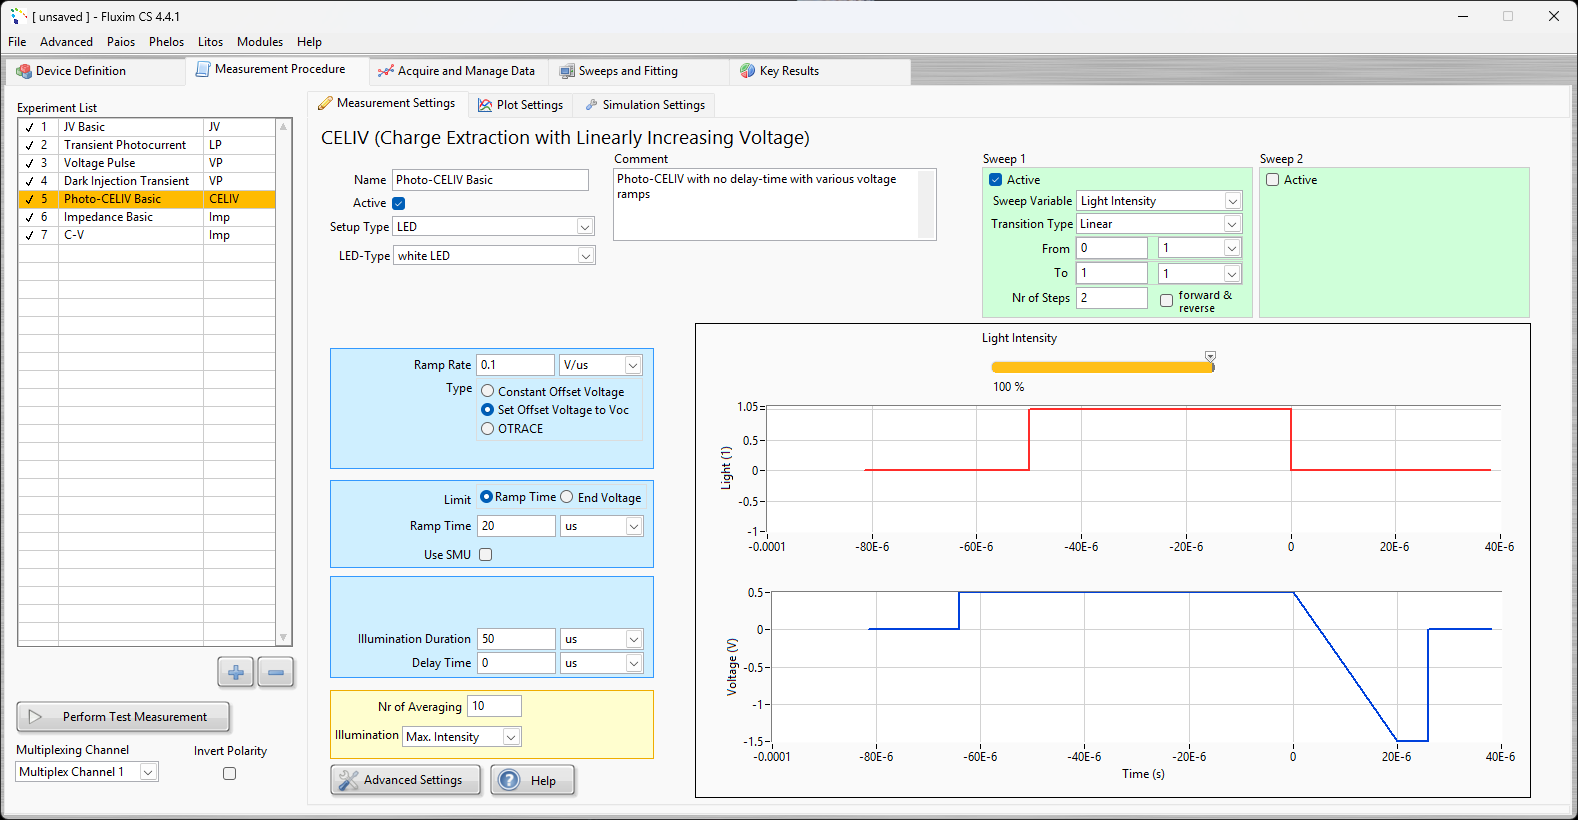
Screenshot of a scientific measurement software interface titled Fluxim CS 4.4.1, displaying experiment settings for Charge Extraction with Linearly Increasing Voltage, including experiment list, measurement procedures, and graphs of light intensity and voltage over time.

Screenshot of Picoscope software displaying a 2D line plot of device current versus device voltage for a test labeled 'JV' with multiple lines representing different light intensities. The interface includes experiment list, measurement settings, plot options, and a measurement procedure panel.

Fluxim software interface displaying voltage adaptation process with a graph of current over time and a status log showing 'Photo-CELIV (Voltage adapted)' readings.

Computer software interface for measuring the stress response of a device, with options for electrical and optical stress, including stress type, levels, timing, and measurement parameters.

Screenshot of some measurement data in Fluxim CS software, showing a graph of conductance versus frequency with two data series, labeled P3HT:PCBM. The interface includes device groups and measurement options on the left, with controls for display and export at the bottom.

Screenshot of Fluxim CS software showing device parameters, setfos device structure, and simulation settings interface.

Equivalent Circuit Fitting for Impedance Measurements
