How to reduce loss channels and defects in large-area organic solar cells
Solar panels are not just large versions of laboratory-scale photovoltaic cells. Going from a small, millimeter-sized cell to a large, meter-sized panel comes with its own challenges. The goal when scaling up is to have easy to deploy, cost-effective solar panels which preserve the power efficiency of the small subcells. Optimizing a small-scale solar cell mainly consists of choosing optimal layer materials, their thickness and add corrugated interfaces to improve photon absorption, charge generation, and charge extraction at the electrodes. These optimization steps are very well supported by our 1D solar cell simulation software called SETFOS. SETFOS can not only be used to understand and optimize purely the optical characteristics of solar cells but also coupled opto-electrical simulations are supported.
A pure 1D simulation is able to optimize the layer stack structure but does not allow to design, understand and improve lateral current flow in the electrodes to the external contacts of the solar panel. This lateral resistance reduces the operating voltage and reduces the applied voltage over the solar cell layer stack depending on the geometry. Additionally, the solar cell itself might contain inhomogeneities and even shunts which redirect the current flow and lead to local voltage drops and efficiency losses.
Our 2D + 1D software LAOSS is a perfect tool to understand and improve on different upscaling strategies which combine 1D layer stack with 2D lateral simulations. In this blog post, we will discuss the findings by Matthias Diethelm and his colleagues who used LAOSS to simulate centimeter-sized organic solar cells to understand loss channels and macroscopic defects. [1]
This tutorial will be useful if you are struggling to understand the effects of shunts and defects on the JV curves of your perovskite solar cells.
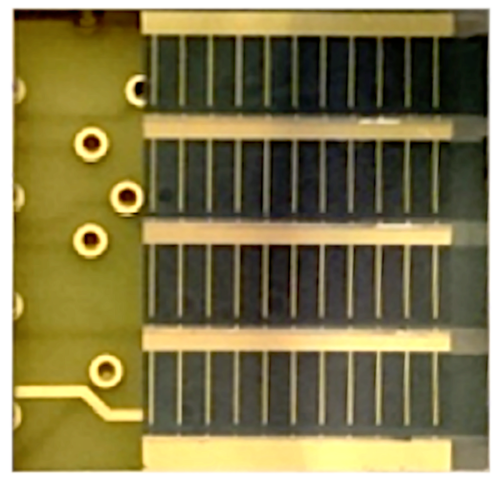
Figure 1: Optical image of the centimeter-sized solar cell used in this study.
Simulation
The basic assumption in the 2D + 1D approach is that the lateral flow of the current only occurs in the electrodes of the solar cell. Inside the semiconducting layer, the current flows only perpendicular to the electrodes. This assumption is justified by looking at the conductivity of the semiconducting layer and compare it to the conductivity of the electrodes as well as the thickness of the solar cell compared to its size. Both of these parameters are orders of magnitudes different and therefore the assumption to split the current flow is reasonable. With this approach, an initially 3-dimensional numerical problem can be split into a 2 dimensional and 1-dimensional numerical problem (Fig. 2.). In general, this approach allows to simulate and optimize small features in the semiconducting layers at the same time as the orders of magnitude larger geometrical dimensions of the electrodes.
In this study, the perpendicular coupling between the anode and cathode is modeled with three possibilities. It is either:
1. zero, if the cathode and anode are not connected,
2. ohmic, if there is a shunt
3. a diode model, for the active area of the solar cell.
The heat transfer in and along the layers is also split into a lateral and perpendicular contribution (Fig. 2.). Heat dissipation to the surrounding atmosphere and Joule heating due to lateral and perpendicular current flow is then calculated.
The electrical and thermal models are coupled with an exponential dependence to have an increased diode current at elevated temperatures.
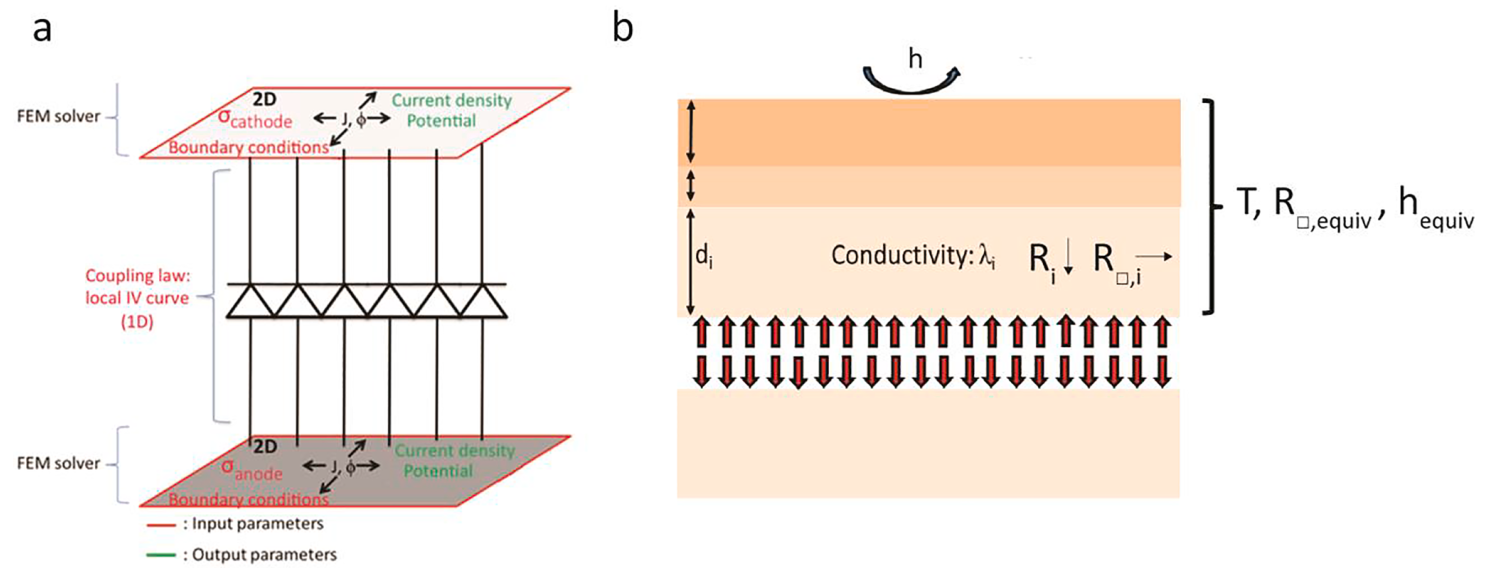
Fig. 2. Model schematics for the electrical (left) and thermal model (right). For the electrical simulation, the model has been split into a 2D lateral and 1D perpendicular part, where the lateral part describes current flowing in the electrodes and the perpendicular part describes current flowing through the semiconducting layer. The thermal simulation splits the solar cell stack into 2 layers, one above and one below the active layer respectively. Additionally, heat dissipation to the surrounding air is incorporated
Measurements
Electroluminescence (EL) imaging is used to map the current flow through the active layers of the organic solar cell. The electroluminescence signal results from radiative recombination of charge carriers and is therefore proportional to the local current flow through the diode perpendicular to the electrodes. With these methods, shunts but also photo-current-inactive regions can be visualized easily, as both of them appear as a dark spot.
Thermal (IR) imaging is a method to map shunts in a large area solar cell. Shunts lead to higher local currents which lead to an increase in temperature. In contrast to EL imaging, inactive regions will appear cooler than the rest of the cell. Thus, the combination of EL and IR imaging is highly interesting. Thermal equilibrium was reached after about a minute of applying a voltage to the electrodes.
Two different organic solar cells have been analyzed in this study. EL and IR images were quantitatively simulated with the simulation software LAOSS in order to quantify the defects. The second organic solar cell under investigation was then also cut to further investigate the smaller shunts and study their contribution to the overall current and therefore temperature distribution.
Results
Electroluminescence measurements and simulation (Fig. 3.) show that the assumption that the current density describes the luminescence signal holds. In the simulation in Fig. 3., the absorption of the emitted photons by the top electrode is not taken into consideration. The simulated current density is the highest right below the electrodes, but the generated photons would never leave the solar cell as they are absorbed in the top electrode. The overall dimming of the electroluminescence signal is simulated accurately and is a direct consequence of the sheet resistances of the electrodes. By comparing measurement and simulation, the sheet resistance has been extracted.

Fig. 3. Electroluminescence image (top) and current density (bottom). The overall trend of reduced electroluminescence from left to right is simulated accurately.
Thermal Imaging and electrothermal simulations (Fig. 4.) Show that the electrothermal coupling in LAOSS reproduces local temperature effects to a high degree. This means that not only the local temperature due to self-heating is calculated properly, but also the feedback loop through temperature-dependent conductivity is handled properly and is essential in describing the loss channels.

Fig 4: Thermal imaging (top) and electrothermal simulation (bottom) of the organic solar cell. Not all shunts have been simulated. In a later step, the solar cell has been cut along the indicated line and remeasured to study the influence of the larger shunts.
To understand the influence of individual shunts, the researchers cut the flexible organic solar cell into two. This influences not only the current density landscape but also the overall temperature of the solar cell. Both phenomena are seen in the LAOSS model as well (Fig. 5).
Further investigation of the individual shunts and their influence on the overall device characteristics, has shown that the number of shunts and their location on the subcell is of utmost importance to model the JV characteristics of the full module. If just one subcell is shunt-free, it dominates the JV curve around the short-circuit condition (i.e. zero applied voltage) for the whole module. Therefore, the whole solar cell module appears to be shunt-free even though several shunts are present.

Fig. 5. Measured and simulated JV-curves of the solar cell with and without cutting away a large shunt (left) and temperature profile for the same scenarios (right). Relative temperature changes in the sample are very well simulated. Cutting the sample to remove the dominant shunt is very well reproduced using LAOSS with an overall increase of the device temperature and additional temperature bump around the 40 mm position.
In conclusion, we can see that with the help of LAOSS the researchers have been able to reproduce and understand the electrothermal measurements done on their centimeter-sized organic solar cell. The sheet resistance of the individual electrode layers could be determined by fitting LAOSS simulations to electroluminescence images.
Therefore, LAOSS empowers everyone to investigate and understand the influence of lateral non-uniformities by comparing non-invasive optical and infrared imaging methods with electrothermal 2D + 1D simulations. The extracted parameters enable researchers to further optimize their solar modules by a pure simulation approach. Engineers can use LAOSS to find optimal electrode geometries by balancing active layer shadowing with charge carrier extraction efficiencies and speed up the development cycle in every R&D facility.
If we piqued your curiosity about how Laoss can support you in tackling the challenge of scaling up your solar cells, get in contact with us.
References
[1] M. Diethelm et al., "Finite element modeling for analysis of electroluminescence and infrared images of thin-film solar cells", Solar Energy, 209, 2020