How to quantify Non-radiative voltage losses and recombination in solar cells

The open-circuit voltage (Voc) is the electrical potential difference between the two terminals of a solar cell, when there is no external load applied, no electric current flows. Correspondingly, when a voltage equivalent to the Voc is applied to the terminals of the solar cell, the recombination current (Jrec, which typically follows a non-ideal diode equation) and the photocurrent (Jph, the current generated by illuminating the solar cell) are equal, hence the net current is zero (Jrec=Jph at V= Voc).
The Shockley-Queisser model defines the maximum achievable voltage of a solar cell as Voc,sq. Two important assumptions of the model are that: 1) the solar cells absorb all the photons with energy bigger than the bandgap (Eg) of the solar cell and 2) that radiative recombination (the release of a photon by the recombination of an electron in the conduction band with a hole in the valence band) is the only radiative recombination occurring.
In the case of real materials, the light absorption is imperfect, hence not all the photons with sufficient energy are absorbed, due to material finiteness (the absorbing material is not infinite and presents surfaces), reducing the maximum voltage to its radiative limit (Voc,rad).Solar cells often present also non-radiative recombination mechanisms, in addition to the radiative one, as a result of poor material quality and non-idealities (e.g.: bulk defects and grain boundaries). It follows that the measured Voc is smaller than Voc,rad. The amount of voltage loss due to non-radiative recombination is simply quantified by the equation:

To increase the Voc and thus potentially the power conversion efficiency, it is necessary to minimize ΔVoc,nrad. It is, therefore, necessary to quantify the total loss and determine its origin.
Electroluminescence (EL) and photoluminescence quantum yield (PLQY) allow extracting the ΔVoc,nrad for thin-film solar cells such as perovskite solar cells, kesterite, organic, or quantum dot, directly.
After quantifying the losses, the combination of capacitance-voltage (CV), temperature-dependent voltage characteristics (JV-T), and capacitance-frequency (Cf-T) measurements are essential to identify the recombination mechanisms.
This blog presents the application of such characterizations on solar cells based on kesterite (Cu2ZnSn(S,Se)4 - CZTSSe) absorbing material with varying content of Li or Sn. Through the analysis of the characterization results, it was possible to understand how the absorber composition influences the defect profile, doping concentration, and band alignment in the solar cell. Eventually, these properties are correlated with the measured amount of ΔVoc,nrad.
The reported results have been extracted from the Ph.D. thesis of Dr. Antonio Cabas Vidani titled:” Reducing non-radiative recombination in solution-processed kesterite thin-film solar cells”.
Voltage loss extraction from photoluminescence
The emission of photoluminescence (PL) radiation of a solar cell is measured after altering the thermal equilibrium of a solar cell by shining a light with sufficient energy (in this case a laser with a 640 nm wavelength) on it. With a calibrated PL setup it is possible to determine the absolute photoluminescence quantum yield (PLQY), which allows calculating the non-radiative voltage losses with the formula [Red17]:

where k is the Boltzmann constant, T is the temperature and PLQY is the measured (calibrated) PLQY. An advantage of the PL measurement is that it does not require electrical contacts and it is sensitive to the surface properties.
The PLQY measurement was carried out on a series of kesterite solar cell devices with increasing Li content. Li is known to alloy with the kesterite absorbing material by substituting Cu, for this reason, the incorporated amount is indicated with the Li/(Li+Cu) ratio [Cab18]. For the study, the ratio varies from 0 to 0.07 and it will be expressed with x in the following text.
Figure 1 shows an increase in PLQY together with x, which correlates with the decrease in ΔVoc,nrad as extracted with equation 2. It is important to consider that the internal PL yield is equal to the product of the minority carrier lifetime (τn), the majority charge carrier concentration (p0) and the material-specific radiative recombination coefficient (B): PLQY=τnBp0. [Hag17][Red17][Uno16]
the coefficient B is calculated using the density of state values reported by Persson et al. (J. Appl. Phys., 2010, 107), and here it is assumed that it does not vary significantly with x. It follows that an increase in PLQY can indicate an increase in minority carrier lifetime, thus a reduction in non-radiative recombination, as well as an increase in majority charge carriers.

Figure 1 – External photoluminescence quantum yield and ΔVoc,nrad.
Charge carriers estimation with capacitance measurement
Kesterite solar cell structure necessitates the presence of a pn-junction for an effective carrier collection, where the kesterite absorber is the p-type doped material. To assess the doping concentration, capacitance-voltage (CV) measurements at room temperature were carried out. The relation between the doping concentration (NA) in the kesterite material and the capacitance can be expressed via the so-called Mott-Schottky representation where:

as the capacitance of the space-charge region. The calculated NA is typically referred to as the “apparent carrier concentration”, since several non-idealities may contribute. From the Mott-Schottky plot, one can also deduce the built-in voltage (Vbi), which then allows the estimation of the space-charge region (SCR) width.
The post-processing routine for the determination of the carrier concentration is available in Paios
Figure 2 reports NA vs SCR width as measured with CV at room temperature at 0V revealing an increase of apparent carrier concentration from 3×1015 cm−3 for the sample without lithium up to 5×1016 cm−3 for the sample with x = 0.07.

Figure 2 – apparent carrier concentration determined by room-temperature CV measurements at 0V.
Under the assumption that B does not change significantly with x and that NA derived from CV approximates p0, it can be concluded that the observed increase in PLQY is mainly driven by the increase of p0 and not by a significant increase in τn.
Identification of recombination through electroluminescence and T-dependent measurements
With electroluminescence (EL) measurements the non-radiative voltage losses in solar cells with metal contacts can be extracted. Based on the reciprocity principle, a solar cell can act also as a light-emitting diode (LED). [Rau07] This means that by altering the thermal equilibrium of the solar cell device with the application of an external voltage, it will emit a measurable luminescence. The external luminescence is the result of radiative recombination in the device and it is, therefore, an indicator of internal optical losses when additional recombination mechanisms are present.
The LED electroluminescence quantum efficiency (EQELED) is directly correlated to the non-radiative recombination through the equation:

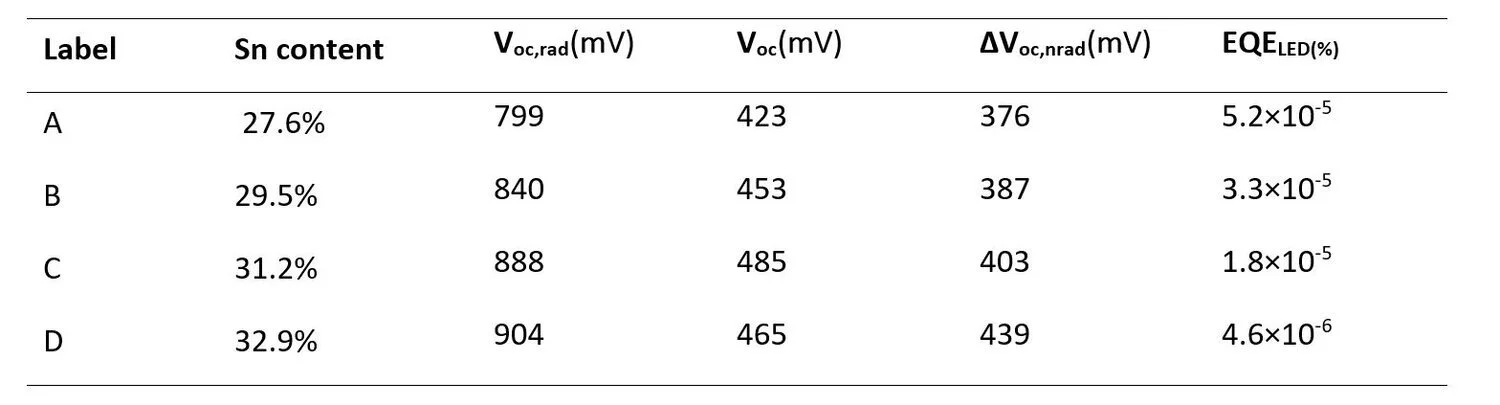
where q is the elementary charge and kB is the Boltzmann constant. Electroluminescence is measured at different injection currents and EQELED(Voc) is the electroluminescence external quantum efficiency (ratio of emitted photons to the injected charge carriers) of the solar cell at an applied bias of Voc. The above-described method was applied to a series of kesterite solar cells where the Sn content was varied. Devices A, B, C, and D correspond to CZTSSe absorbers with nominal Sn concentrations of 27.6, 29.5, 31.2, and 32.9 at.%, respectively. From Table 1 it can be noticed that, while Voc,rad (calculated with equation 4 by measuring Voc and EQELED of the solar cell) increases by more than 100 mV across the series, Voc increases by only 60 mV, from 370 mV to 430 mV. This leads to a ∆Voc,nrad which is higher by more than 60 mV in device D compared to device A, and consequently a lower EQELED. In other words, a larger fraction of charge carriers recombine radiatively rather than non-radiatively in device A, as compared to device D. From these results one can say that the CZTSSe absorber with the lowest Sn content (device A) has a Voc which is the closest to its radiative limit in this series. Moreover, device A shows the highest EQELED of the series with a value of around 5×10⁻⁵ %, which is among the highest reported values for CZTSSe devices [Yam17]. However, even the highest EQE measured in our device series is several orders of magnitude lower than typical values for CIGS (0.03 %) or Silicon (0.13 %) solar cells. [Kir07]
Locating the non-radiative recombination with T-dependent measurements
To analyze the defect profile, Cf-T and JV-T measurements were carried out to further investigate what controls EQELED in our kesterite solar cells. They respectively provide information about the activation energy of the main trap state, and the dominant recombination. Figure 3a shows the Cf-T curves measured at temperatures in between 123 K to 323 K for device A and it is representative for the other devices (not shown here). The capacitance profile exhibits transitions to lower values at specific frequencies. The change in the capacitance value represents a variation in the response of the charges in the solar cell to the increasing frequency. The frequency at which the transition occurs is the so-called inflection frequency (ft) and it is the local maximum of the capacitance profile derivative. The value ft was extracted from the Cf curves of all the devices of the series at different temperatures. In a previous work, ft is assumed to relate to the emission coefficient of the defect state and, therefore, to its energy. [Wei15][Gun12] It follows that the activation energy of the dominant trap state in a Shockley-Read-Hall representation (Ea,CfT) can be extracted from the slope of an Arrhenius plot of ft (Figure 3b).
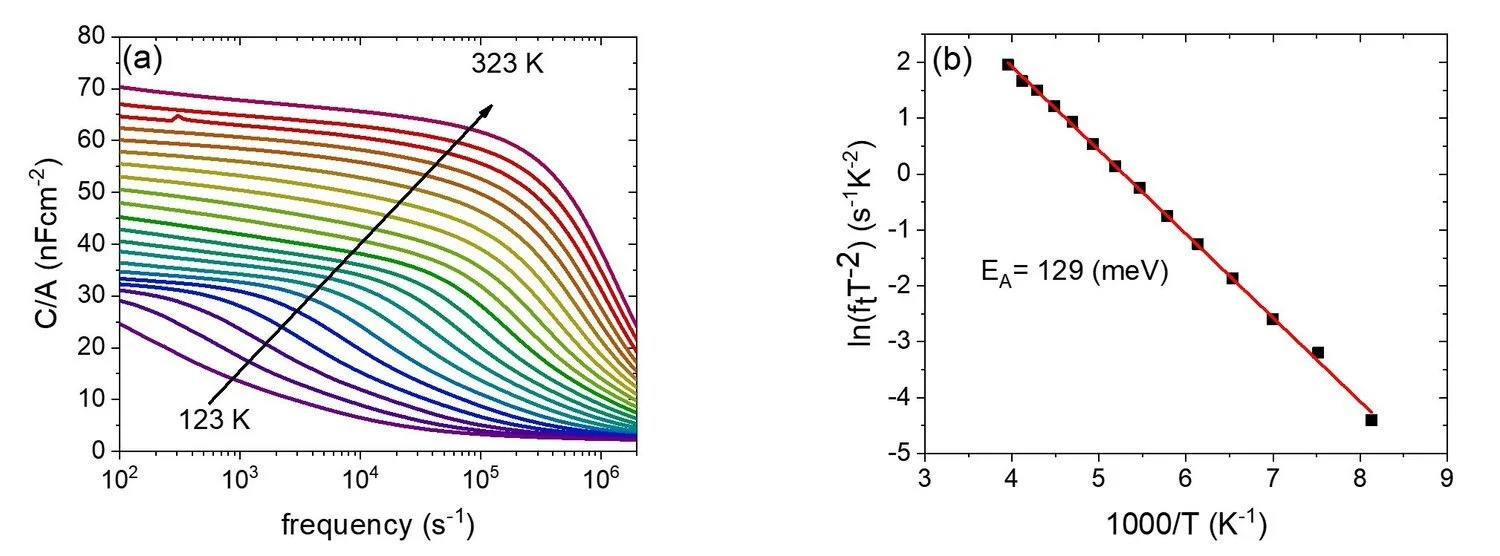
Figure 3 – a) representative temperature-dependent capacitance-density frequency measurements in the temperature range from 123 to 323 K with 10 K steps and frequencies from 100 Hz to 1 MHz of a device from sample A (Sn content of 27.6 at.%). b) Arrhenius plot of the inflection frequencies of a device from sample A.
As kesterite absorbers are p-type semiconductors, Ea,CfT is considered to be the energy difference between the trap energy (Et) and the valence band maximum energy (EV), which can therefore be written as:

Figure 4a shows Ea,CfT (blue line) calculated using the above-described procedure for all devices, together with the bandgap extracted from the EL spectra (black line). The relative energy of the dominant trap state does not change significantly with the Sn content.
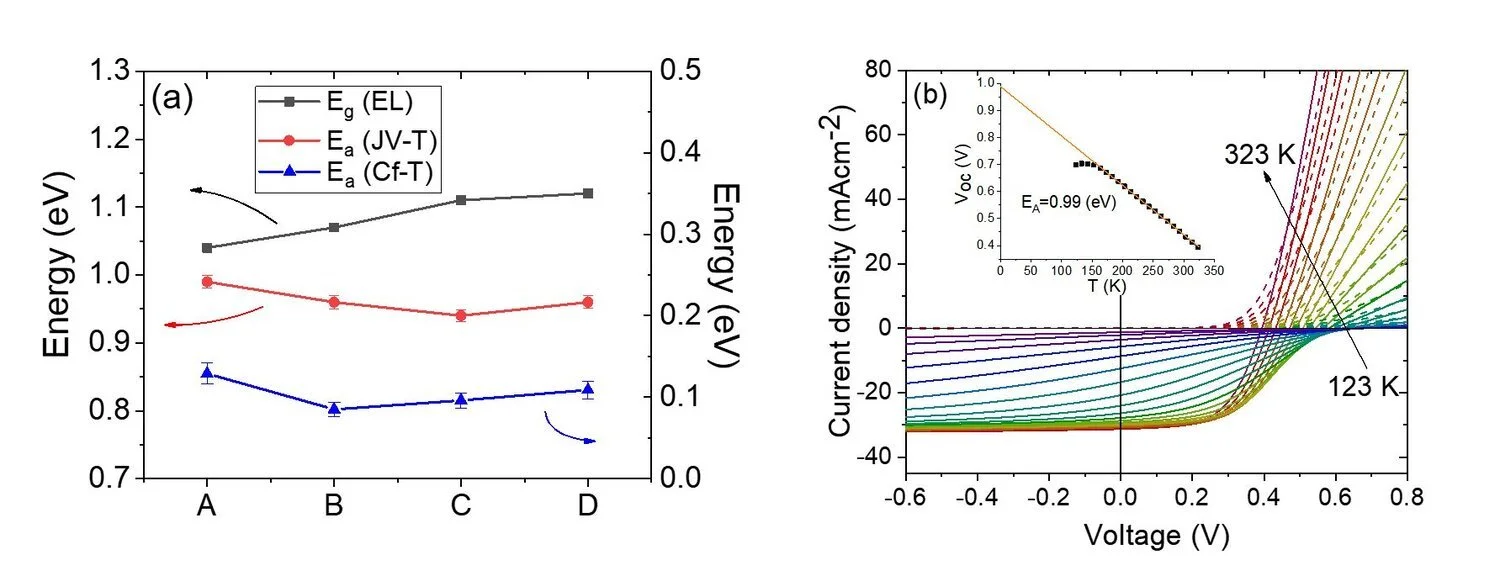
Figure 4 – a) comparison among bandgap energy (Eg,EL) as obtained from EL measurements, activation energy of the main recombination mechanism (Ea,JVT) obtained by JV-T measurements and activation energy of the main defect (Ea,CfT) obtained by AS for samples with increasing Sn content in the precursor solution (A-27 at.%, B-28.7 at.%, C-30.5 at.%, D-32.2 at.%). b) JV-T measurement (dark curve: dotted line, light curve: solid line) of device A (Sn content of 27.6 at.%). The inset shows a linear fit of Voc extrapolated to T = 0 K, a fitting error of 1% is taken into account.
Note, that defect densities and energies are usually expected to affect the EQELED of the device strongly. However, while in the studied series EQELED changed significantly with Sn content, the defect states properties remained unchanged. This observation suggests that the measured change in EQELED with Sn content results not from trap states in the absorber, but a different cause. To investigate this further, JV-T measurements for device A were carried out under AM1.5G illumination (Figure 4b). Similarplots for the rest of the series are reported elsewhere. The crossover of illuminated and dark JV-T curves becomes more pronounced at lower temperatures, whereas the increasing rollover leads to complete blocking of the current at the lowest temperature of 123 K. The inset shows the temperature dependence of the Voc, where the linear extrapolation to 0 K provides the activation energy of the dominant recombination mechanism Ea,JVT. [Nad00] For device A the obtained Ea,JVT = 0.99 eV is close to the derived bandgap Eg,EL = 1.04 eV; thus the dominant recombination is within the bulk of the absorber rather than at the interface. While the bandgap increases with Sn content, Ea,JVT decreases slightly. Possible reasons for this are either worsened interface quality, such as roughness, surface recombination, and etching issues, or worsened band alignment, specifically with the CdS n-type layer (deposited on top of the kesterite absorber) since Sn is expected to mainly affect the conduction band minimum of the absorber. [Shu13][Che09] An increasing mismatch between the conduction bands at the pn-junction could explain the decrease of the EQELED with Sn content.
With PAIOS you can quickly extract the above-mentioned parameters with the included post-processing software
Conclusions
The presence of non-radiative voltage losses (ΔVoc,nrad) in solar cell devices hinders photovoltaic performance. Photoluminescence and electroluminescence measurements are powerful characterization methods that allow to extract the amount of losses directly.
In combination with trap analysis techniques (e.g.: CV, JV-T, and Cf-T), the EL and PL analysis of kesterite solar cells with varying lithium or tin content was key to assess the influence of different absorber compositions on voltage losses.
A similar investigation routine can be applied to perovskite solar cells where the perovskite absorbing layer can be obtained with a large variety of absorber compositions. An all-in-one characterization tool like Paios minimizes the amount of instrumental error compared to carrying out all the measurements separately with different instruments.
The understanding of the non-radiative recombination mechanisms for inorganic and organic thin-film solar cells is just a few clicks away with the combination of Phelos, Paios and their coupling with simulation software Setfos.
References
[Uno16] T. Unold, L. Gütay, “Adv. Charact. Tech. Thin Film Sol. Cells Second Ed.”, vol. 275, pp. 1–2, 2016.