WHY PEROVSKITE SOLAR CELLS WITH HIGH EFFICIENCY Show small iV-curve hysteresis
Hysteresis effects are weak if both the charge diffusion length is long and the surface recombination is low
In many perovskite solar cells (PSCs), hysteresis is observed between the forward and reverse current-voltage (IV) scans. This IV curve hysteresis can be problematic for the correct determination of the Power Conversion Efficiency (PCE). While the exact origin of the IV curve hysteresis has remained a topic of debate, it is now widely accepted that mobile ions are the principal cause. However, it is still the subject of ongoing debates about how exactly mobile ions influence the device operation.

In this blog, we are showing how a proper drift-diffusion simulation can help in understanding how mobile ions are affecting the JV characteristics of a perovskite solar cell. We investigated the influence of charge surface-recombination and diffusion length on the IV-curve hysteresis and demonstrated that If surface-recombination is low (well-passivated surfaces) and bulk-recombination is also low, charge carriers can diffuse to the correct contact even if mobile ions screen the electric field. This study explains why highly efficient solar cells often show less hysteresis. We provide a detailed explanation for the reduced hysteresis of perovskite solar cells with high PCE. We find that in high-efficiency solar cells ion migration is still present, but does not cause hysteresis. In these devices, charge extraction is mainly driven by the diffusion of free electrons and holes.
Hysteresis in PSCs - Experimental Methods
To study the influence of mobile ions it is helpful to use experiments that distinguish ionic from electronic processes. These species have different mobilities and this helps to perform experiments in which the ionic motion is decoupled from the electron/hole motion.
When an IV-curve is measured with a voltage-ramp up and down, processes of ionic charge transport and electronic charge transport are both involved. With commonly used scan-rates it is not possible to study ions and electrons/holes, separately. In order to distinguish ionic from electronic charge transport, we thus perform IV characterizations with very high ramp-rates after preconditioning the device for 10 seconds at a constant voltage. The long preconditioning time allows the ions to move and equilibrate in the device. The preconditioned IV-curves are acquired with the all-in-one measurement system Paios.
With Paios we performed also several transient experiments, such as TPC/TPV, on perovskite solar cells as a function of the preconditioning time. The figure shows a typical Transient PhotoCurrent (TPC) experiment on a pero-PV.

Figure 1: TPC experiment on a perovskite solar cell with different precondictioning times at a constant voltage.
Do you want to learn how to use PAIOS? You can get in contact with us
Hysteresis in PSCs - Numerical Model
To simulate the preconditioned IV-curves of our perovskite solar cells we used the simulation software Setfos.
We profit from the fact that ionic motion and motion of electrons and holes occur at different time scales and can be investigated separately. This allows us to simulate first the ion distribution as a result of preconditioning and then the charge transport of electrons and holes in the presence of the fixed ion distribution. The prerequisite of this approach is that ions do not move during the fast IV-ramp and that the electronic charge carrier concentration is much smaller than the concentration of ions during the preconditioning, such that the electrons and holes do not significantly alter the electric field. The device structure and the simulation domain are shown in Fig. 1. The absorbing layer is modeled as one effective material with one transport-level for electrons and one for holes, respectively. The compact TiO2 and the Spiro-OMeTAD (hole transport layer) are modeled as metallic because we assume that their doping density is high enough to fix the Fermi-level at the interface with the perovskite.
The drift-diffusion equations for the mobile ions are solved first. Neumann boundary conditions of zero flux (no ions can enter or leave the perovskite layer) and an initial ion density with uniform distribution are used. The resulting steady-state ion distribution at the preconditioning voltage is then used in the second drift-diffusion simulation as fixed charges. The second drift-diffusion simulation solves for the electronic charge distributions in the bulk and uses fixed electronic charge carrier densities as boundary conditions. To simulate surface recombination 3-nanometer thin recombination layers are used at the interfaces with the transport layers on both sides. Changing the recombination coefficient of each of these thin layers effectively controls surface recombination at the perovskite layer interface. The physical cause of the interface recombination could be energetic states (interface traps) at the interface leading to ShockleyRead-Hall recombination.
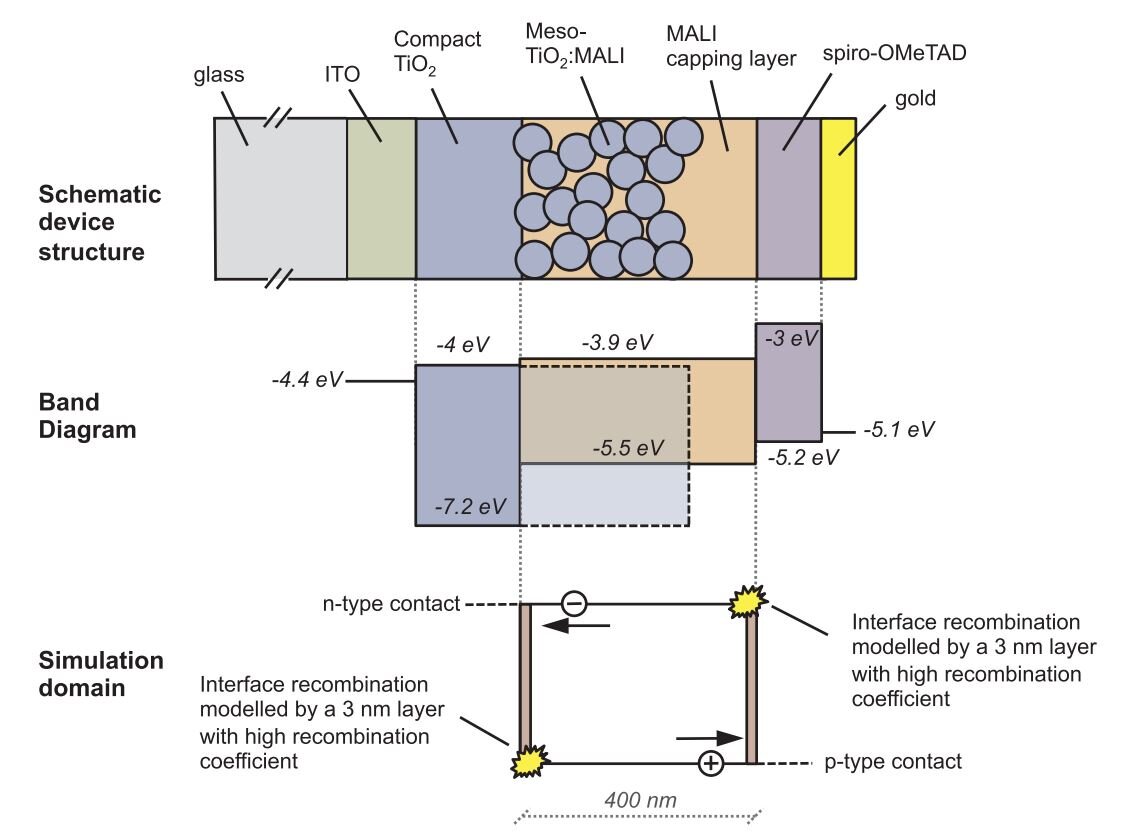
Figure 2: Device structure, schematic band diagram and simulation domain of the perovskite solar cell.
Do you want to learn more about Setfos?
Experimental Results and Simulations
At first, we collected JV curves under AM1.5G at a slow scan rate of 0.1 V/s. As seen in the Figure, the hysteresis is small, because at this scan rate mobile ions can follow the changes in the voltage.

Figure 3: IV-curves measured under AM1.5 with forward and reverse scan and a reverse dark-scan.
By increasing the scan rate, an increase of the hysteresis is observed. The IV-curve at higher scan-rate shows a crossing point and an S-shape in the forward scan. At the highest used rate, two crossing-points occur and the hysteresis is most pronounced.
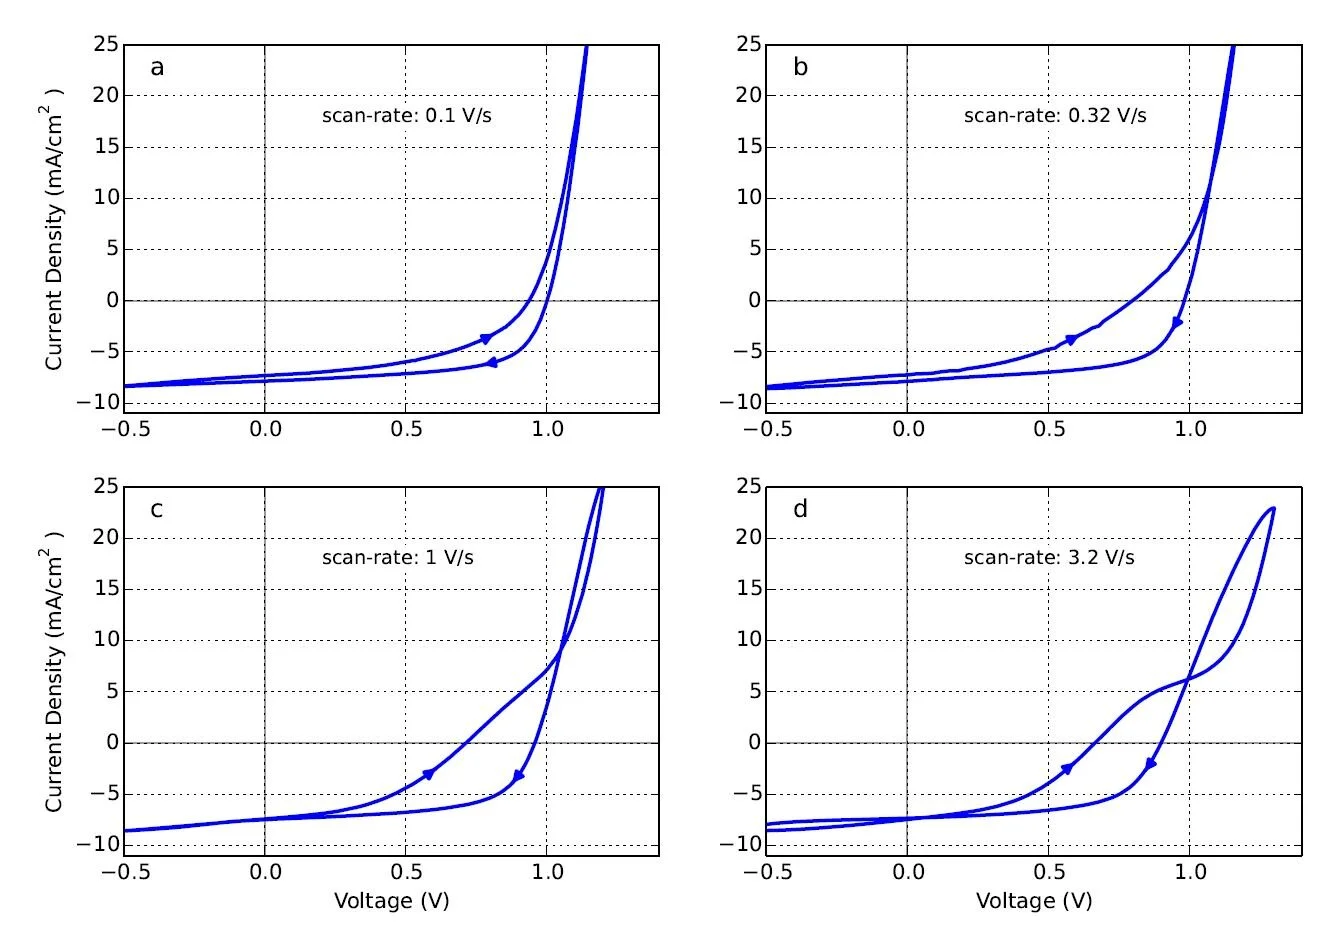
Figure 4: IV-curves measured with different scan-rates. Arrows indicate the scandirection.
Our tutorial “Characterization Techniques for Perovskite and Organic Solar Cells” can help also understanding all the optoelectrical characterizations that can be performed on a solar cell.
As said before, preconditioned IV-curves allow separating the influence of mobile ions and electronic charges. Although the IV-curve is measured within 70 milliseconds, the electrons and holes can be considered in steady-state at each voltage-point due to their high mobility. The ions however are too slow to follow the voltage-ramp, thus we consider the ion distribution in the perovskite layer as unchanged during the IV-sweep. Our characterizations of a perovskite PV with different preconditioning are reported in Figure 5, together with a ramped JV curve collected without preconditioning. The upward sweep of the curve measured without preconditioning is comparable to the IV-curve preconditioned at 0 V, whereas the downward sweep is comparable to the IV-curve preconditioned at 1 V. The ramp of 10V/s is slow enough such that the ions have time to partially adjust in the electric field during the scan. By analyzing the preconditioned IV-curves at 0 and 1 volt we can make direct conclusions about the hysteresis observed with finite scan rates.

Figure 5: Comparison between IV-curves measured with different preconditioning (acquired with a fast upward-ramp after 10 seconds preconditioning at 0 volt or 1 volt) and an IV-curve measured with a ramp-up and down. The arrows indicate the sweep direction.
The preconditioned JV curves can also be simulated with Setfos.
We use the drift-diffusion module of Setfos, which has an ion charge transport solver, to provide a possible explanation for the observed effects. The experimental characteristics and the simulations are compared in Figure 6. The simulation reproduces the significant features of the two preconditioned IV-curves even if the shift in open-circuit voltage is less pronounced compared to the measurement. The simulation results compare well to the experimental IV curves. When analyzing the electric field distribution on the stack at different preconditioning voltage we can also understand that the underlying electronic and ion charge distributions are responsible for the distinct behavior of preconditioning at different pre-bias.
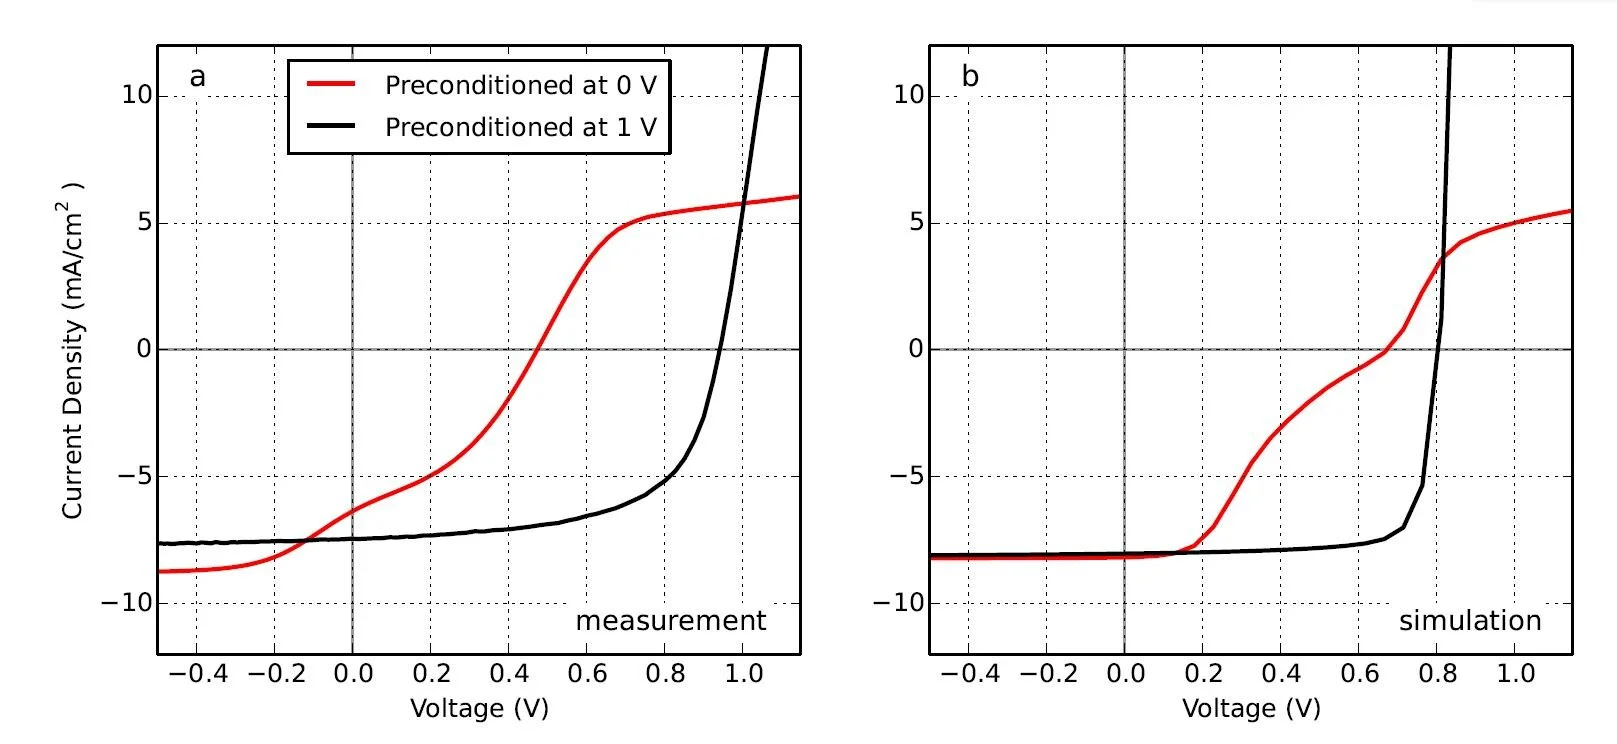
Figure 6: Measured IV-curves of a methylammonium lead iodide (MAPI) perovskite solar cell that was preconditioned at 0 and 1 volt for 10 seconds. b) Simulation results including mobile ions and surface recombination.
To better understand hysteresis caused by mobile ions we then analyze the influence of surface recombination and the carrier diffusion length on the IV-curve hysteresis. As our perovskite solar cell has a p-i-n structure the apparent diffusion length cannot be considered as a quantity that describes how far charges diffuse. The diffusion length depends on the charge density, which for an intrinsic material varies spatially. Consequently, also the lifetime varies within the device. However, it can be employed as a measure of how well charges are transported to the contact layers under illumination. Therefore, we use it here to quantify the charge extraction properties of our solar cell. We name it pseudo diffusion length to emphasize that it cannot be directly compared with the diffusion length extracted from experiments, such as transient photo-voltage (TPV). The pseudo diffusion length does not describe how far charges diffuse but is rather a quantification for how well charges are extracted.
In Figure 7 we illustrate four extreme cases of simulated preconditioned IV curves using combinations of short and long diffusion lengths with low and high surface recombination. In the case of a small diffusion length and high surface recombination, the hysteresis is most pronounced (Figure 7c). In the opposite case (Figure 7b) with a long diffusion length and low surface recombination, the hysteresis is very low. If the diffusion length is short (Figure 7a) or the surface recombination is high (Figure 7d) a pronounced hysteresis is observed.
We conclude that both large diffusion length and low surface recombination are required to obtain IV curves with small hysteresis.

Figure 7: Simulation of IV-curves with different preconditioning voltage and, therefore, different ion distributions.
More information about the models we used can be found here:
In Figure 7 we have demonstrated simulated IV-curves for cells with distinct combinations of surface recombination rates and diffusion lengths for both cases of pre-conditioning. We argue that these simulation results are directly linked to the hysteresis observed in IV-curve measurements with finite voltage ramp rates. To further analyze the expected hysteresis behavior, we define as a quantitative measure for the hysteresis the integrated current difference between the two IV-curves (preconditioned at 0 V and 1 V). This quantity represents the area between the two IV-curves in the graph and is an indication of how severe the hysteresis is.
Figure 8 shows the normalized hysteresis indicator dependent on surface recombination and diffusion length. As already shown in Figure 7 the hysteresis is weak when the surface recombination is low and the diffusion length is long.

Figure 8: Simulation of the extent of the hysteresis dependent on surface recombination and the charge carrier diffusion length. The hysteresis strength is the integrated difference of the IV-curves and normalized by the maximum hysteresis.
Solar cells with high power conversion efficiencies (PCE) can only be realized if the diffusion length is sufficiently long and the surface recombination is not dominant. Aiming for high efficiencies by increasing the diffusion length and decreasing the surface recombination has the positive side effect that the hysteresis is reduced, even if the density of mobile ions remains the same.
To illustrate this relationship we plot the calculated PCE in Figure 9 for different surface recombination values and diffusion lengths. The region with the highest efficiency is found where both the diffusion length is long and the surface recombination is low. This high-efficiency parameter region coincides with the region where the hysteresis indicator is small.

Figure 11: Simulation of the power conversion efficiency depending on surface recombination and charge carrier diffusion length.
Our simulation results provide an explanation for why high power conversion efficiency and small hysteresis are correlated. Furthermore, it provides an explanation of why hysteresis depends on contact materials: the contact materials have an influence on the surface recombination.
In our model, we kept the ion density unchanged. It is conceivable that the density of mobile ions depends on the type of perovskite and the processing conditions. Hysteresis is enhanced with the increasing number of mobile ions. Note, that the absolute efficiency also depends on other factors like absorption coefficient and active layer thickness.
Conclusion
Numerical simulations carried on with SETFOS can explain the hysteresis behavior of perovskite solar cells. The simulation is reproducing the experimental results we obtained with PAIOS.
Our results provide an explanation for the observed reduced hysteresis in high-efficiency perovskite solar cells. The IV-curve hysteresis depends on the contact quality (amount of surface recombination) and on the diffusion length of the charge carriers. Hysteresis effects are weak only if both the charge diffusion length is long and the surface recombination is low. Both requirements are also necessary conditions to reach high efficiencies. We thus have established a correlation between high power conversion efficiency and weak hysteresis.
If we have sparked your interest, get in contact with us or directly order a free of charge trial version of Setfos
This study has been published by M. T Neukom et al. on “Solar Energy Materials and Solar Cells”.